

received criticism for poor performance and seemingly arbitrary methodology
[52, 81]. However, based on comparisons with other techniques, the developers
of RIVPACS concluded that TWINSPAN performed well, and the method is still
used within the current RIVPACS framework [80].
Relationships among sites can be visualized using a variety of ordination
techniques, which reduce the n-dimensional hyperspaces created by ecological
distance matrices to fewer (usually 2 or 3) dimensions that best explain the overall
pattern of variability (Fig. 1) [52, 53]. When assemblage–environment responses
are assumed to be linear, principal components analysis (PCA) is commonly used,
whereas when responses are assumed to be unimodal, reciprocal averaging-based
techniques such as correspondence analysis (CA) and detrended correspondence
analysis (DCA) are often used. We agree with others [52, 82] in preferring
nonmetric multidimensional scaling (NMS) to these techniques because NMS
includes no assumptions regarding the underlying data distribution and is highly
effective at explaining assemblage structure while reducing dimensionality. Ordinations are often used for exploratory purposes, for example, to confirm classifications made using other analyses [76], but also may be used directly for site
classification [67, 83].
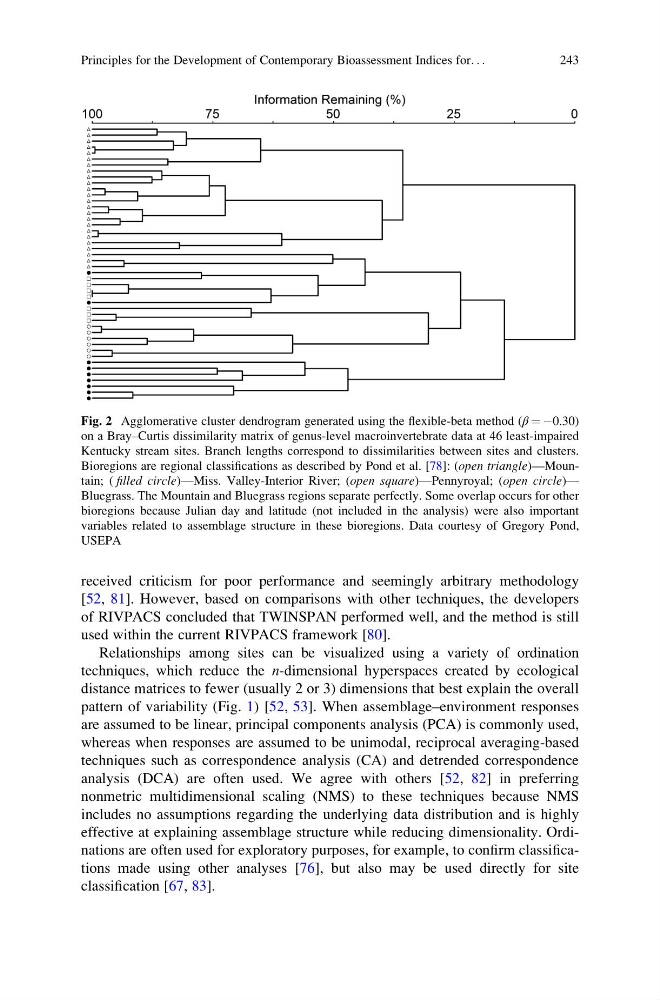
Fig. 2 Agglomerative cluster dendrogram generated using the flexible-beta method (β ¼ À0.30)
on a Bray–Curtis dissimilarity matrix of genus-level macroinvertebrate data at 46 least-impaired
Kentucky stream sites. Branch lengths correspond to dissimilarities between sites and clusters.
Bioregions are regional classifications as described by Pond et al. [78]: (open triangle)—Mountain; ( filled circle)—Miss. Valley-Interior River; (open square)—Pennyroyal; (open circle)—
Bluegrass. The Mountain and Bluegrass regions separate perfectly. Some overlap occurs for other
bioregions because Julian day and latitude (not included in the analysis) were also important
variables related to assemblage structure in these bioregions. Data courtesy of Gregory Pond,
USEPA
Principles for the Development of Contemporary Bioassessment Indices for. . .
243
[52, 81]. However, based on comparisons with other techniques, the developers
of RIVPACS concluded that TWINSPAN performed well, and the method is still
used within the current RIVPACS framework [80].
Relationships among sites can be visualized using a variety of ordination
techniques, which reduce the n-dimensional hyperspaces created by ecological
distance matrices to fewer (usually 2 or 3) dimensions that best explain the overall
pattern of variability (Fig. 1) [52, 53]. When assemblage–environment responses
are assumed to be linear, principal components analysis (PCA) is commonly used,
whereas when responses are assumed to be unimodal, reciprocal averaging-based
techniques such as correspondence analysis (CA) and detrended correspondence
analysis (DCA) are often used. We agree with others [52, 82] in preferring
nonmetric multidimensional scaling (NMS) to these techniques because NMS
includes no assumptions regarding the underlying data distribution and is highly
effective at explaining assemblage structure while reducing dimensionality. Ordinations are often used for exploratory purposes, for example, to confirm classifications made using other analyses [76], but also may be used directly for site
classification [67, 83].
Fig. 2 Agglomerative cluster dendrogram generated using the flexible-beta method (β ¼ À0.30)
on a Bray–Curtis dissimilarity matrix of genus-level macroinvertebrate data at 46 least-impaired
Kentucky stream sites. Branch lengths correspond to dissimilarities between sites and clusters.
Bioregions are regional classifications as described by Pond et al. [78]: (open triangle)—Mountain; ( filled circle)—Miss. Valley-Interior River; (open square)—Pennyroyal; (open circle)—
Bluegrass. The Mountain and Bluegrass regions separate perfectly. Some overlap occurs for other
bioregions because Julian day and latitude (not included in the analysis) were also important
variables related to assemblage structure in these bioregions. Data courtesy of Gregory Pond,
USEPA
Principles for the Development of Contemporary Bioassessment Indices for. . .
243