

2.3.2 Biotic Site Classification
Biotic classification of reference sites came to prominence with the introduction of
the River Invertebrate Prediction and Classification System (RIVPACS, [70, 71]).
Agglomerative cluster analysis is used in many variations of the RIVPACS
approach, including those developed for the USA [72] and the Australian River
Assessment Scheme (AUSRIVAS, [73]), both of which employ presence/absence
data for clustering, and the Benthic Assessment of Sediment (BEAST) method of
Canada [74] which clusters based on abundance data. Agglomerative clustering
proceeds from the bottom up, progressively grouping sites of increasingly dissimilar taxonomic composition. Most investigators cluster sites based on Bray–Curtis
or Sorenson dissimilarity [72–76], although other measures such as Euclidean
distance can be employed [77]. Figure 2 shows a cluster analysis of 46 Kentucky
(USA) stream reference sites where genus-level macroinvertebrate data were collected by the USEPA.
The standard RIVPACS approach classifies sites using two-way indicator species analysis (TWINSPAN, [79]). In contrast to agglomerative cluster analysis,
TWINSPAN is a divisive technique, whereby sites are progressively divided based
on taxa (indicator species) that best differentiate them. Also unlike agglomerative
clustering, the user cannot choose a dissimilarity measure [80]. TWINSPAN has
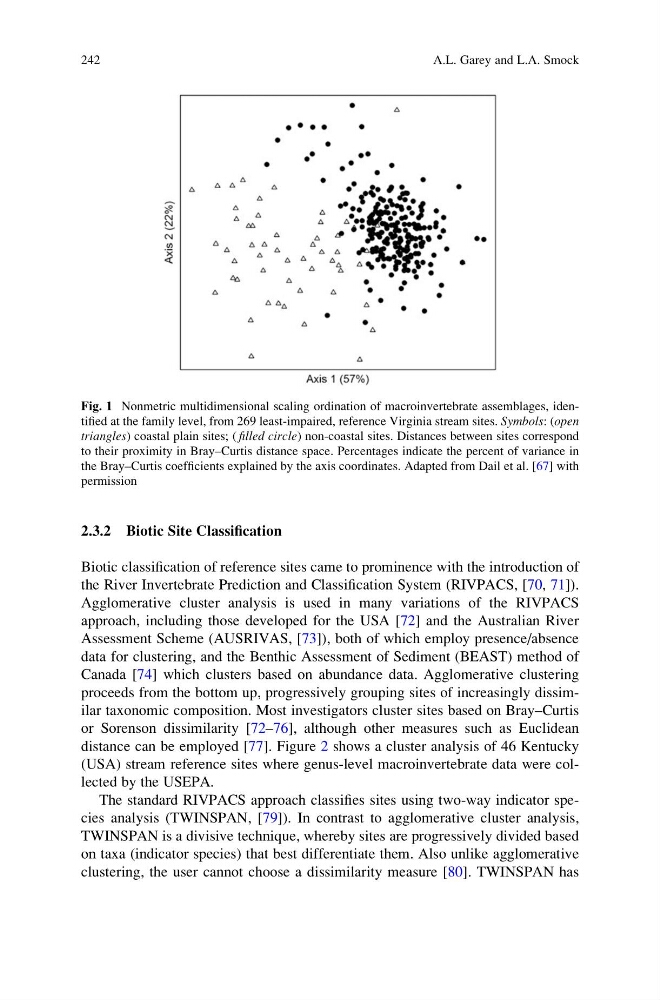
Fig. 1 Nonmetric multidimensional scaling ordination of macroinvertebrate assemblages, identified at the family level, from 269 least-impaired, reference Virginia stream sites. Symbols: (open
triangles) coastal plain sites; ( filled circle) non-coastal sites. Distances between sites correspond
to their proximity in Bray–Curtis distance space. Percentages indicate the percent of variance in
the Bray–Curtis coefficients explained by the axis coordinates. Adapted from Dail et al. [67] with
permission
242
A.L. Garey and L.A. Smock
Biotic classification of reference sites came to prominence with the introduction of
the River Invertebrate Prediction and Classification System (RIVPACS, [70, 71]).
Agglomerative cluster analysis is used in many variations of the RIVPACS
approach, including those developed for the USA [72] and the Australian River
Assessment Scheme (AUSRIVAS, [73]), both of which employ presence/absence
data for clustering, and the Benthic Assessment of Sediment (BEAST) method of
Canada [74] which clusters based on abundance data. Agglomerative clustering
proceeds from the bottom up, progressively grouping sites of increasingly dissimilar taxonomic composition. Most investigators cluster sites based on Bray–Curtis
or Sorenson dissimilarity [72–76], although other measures such as Euclidean
distance can be employed [77]. Figure 2 shows a cluster analysis of 46 Kentucky
(USA) stream reference sites where genus-level macroinvertebrate data were collected by the USEPA.
The standard RIVPACS approach classifies sites using two-way indicator species analysis (TWINSPAN, [79]). In contrast to agglomerative cluster analysis,
TWINSPAN is a divisive technique, whereby sites are progressively divided based
on taxa (indicator species) that best differentiate them. Also unlike agglomerative
clustering, the user cannot choose a dissimilarity measure [80]. TWINSPAN has
Fig. 1 Nonmetric multidimensional scaling ordination of macroinvertebrate assemblages, identified at the family level, from 269 least-impaired, reference Virginia stream sites. Symbols: (open
triangles) coastal plain sites; ( filled circle) non-coastal sites. Distances between sites correspond
to their proximity in Bray–Curtis distance space. Percentages indicate the percent of variance in
the Bray–Curtis coefficients explained by the axis coordinates. Adapted from Dail et al. [67] with
permission
242
A.L. Garey and L.A. Smock