

2.2.5 Chlorophyll and Other Pigments
Predictive models that use ORS to estimate a water quality variable should use
wavelengths that identify key spectral characteristics of the variable without interference from competing optical features of other variables. For chlorophyll, this
means that algorithms commonly used for the open oceans, which involve reflectance in the blue and green regions, do not work well for inland waters because
these waters are influenced by TSS and CDOM. This makes them optically more
complex [43] than open ocean waters, where chlorophyll and chlorophyll-related
properties are the primary factors affecting reflectance. CDOM and SS min have
overlapping absorption features with chlorophyll a in the blue region.
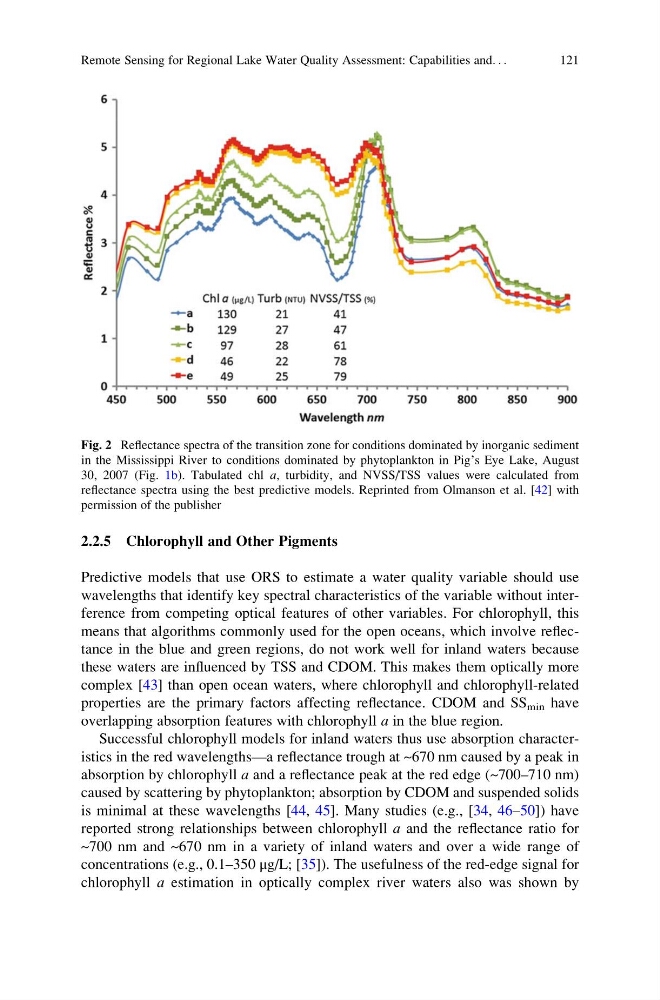
Successful chlorophyll models for inland waters thus use absorption characteristics in the red wavelengths—a reflectance trough at ~670 nm caused by a peak in
absorption by chlorophyll a and a reflectance peak at the red edge (~700–710 nm)
caused by scattering by phytoplankton; absorption by CDOM and suspended solids
is minimal at these wavelengths [44, 45]. Many studies (e.g., [34, 46–50]) have
reported strong relationships between chlorophyll a and the reflectance ratio for
~700 nm and ~670 nm in a variety of inland waters and over a wide range of
concentrations (e.g., 0.1–350 μg/L; [35]). The usefulness of the red-edge signal for
chlorophyll a estimation in optically complex river waters also was shown by
Fig. 2 Reflectance spectra of the transition zone for conditions dominated by inorganic sediment
in the Mississippi River to conditions dominated by phytoplankton in Pig’s Eye Lake, August
30, 2007 (Fig. 1b). Tabulated chl a, turbidity, and NVSS/TSS values were calculated from
reflectance spectra using the best predictive models. Reprinted from Olmanson et al. [42] with
permission of the publisher
Remote Sensing for Regional Lake Water Quality Assessment: Capabilities and. . .
121
Predictive models that use ORS to estimate a water quality variable should use
wavelengths that identify key spectral characteristics of the variable without interference from competing optical features of other variables. For chlorophyll, this
means that algorithms commonly used for the open oceans, which involve reflectance in the blue and green regions, do not work well for inland waters because
these waters are influenced by TSS and CDOM. This makes them optically more
complex [43] than open ocean waters, where chlorophyll and chlorophyll-related
properties are the primary factors affecting reflectance. CDOM and SS min have
overlapping absorption features with chlorophyll a in the blue region.
Successful chlorophyll models for inland waters thus use absorption characteristics in the red wavelengths—a reflectance trough at ~670 nm caused by a peak in
absorption by chlorophyll a and a reflectance peak at the red edge (~700–710 nm)
caused by scattering by phytoplankton; absorption by CDOM and suspended solids
is minimal at these wavelengths [44, 45]. Many studies (e.g., [34, 46–50]) have
reported strong relationships between chlorophyll a and the reflectance ratio for
~700 nm and ~670 nm in a variety of inland waters and over a wide range of
concentrations (e.g., 0.1–350 μg/L; [35]). The usefulness of the red-edge signal for
chlorophyll a estimation in optically complex river waters also was shown by
Fig. 2 Reflectance spectra of the transition zone for conditions dominated by inorganic sediment
in the Mississippi River to conditions dominated by phytoplankton in Pig’s Eye Lake, August
30, 2007 (Fig. 1b). Tabulated chl a, turbidity, and NVSS/TSS values were calculated from
reflectance spectra using the best predictive models. Reprinted from Olmanson et al. [42] with
permission of the publisher
Remote Sensing for Regional Lake Water Quality Assessment: Capabilities and. . .
121