

found useful by Shafique et al. [40]. The scattering peak at ~700 by itself also was
found to work well for NVSS (nonvolatile SS, essentially equivalent to SS min ) [41].
Olmanson et al. [42] found strong relationships between reflectance at 705 nm
and both turbidity and TSS (r
2
¼ 0.77–0.93 for both) using airborne hyperspectral
imagery to assess water quality in the optically complex waters of the Minnesota,
Mississippi, and St. Croix Rivers in the Minneapolis-St. Paul region. Depending on
location and time, CDOM, phytoplankton, and/or SS min all may dominate the
optical properties of these rivers. They also found a predictive equation
(r
2
¼ 0.80–0.90) for volatile suspended solids, VSS, a measure of organic
suspended matter, using the ratio of reflectance at 705 to 670 nm. For SS min they
found that using band at 705 nm and the ratio of reflectance at 705 to 670 nm, a
combined model (TSS and chlorophyll a), yielded an r
2 of 0.85–0.97 for SS min . The
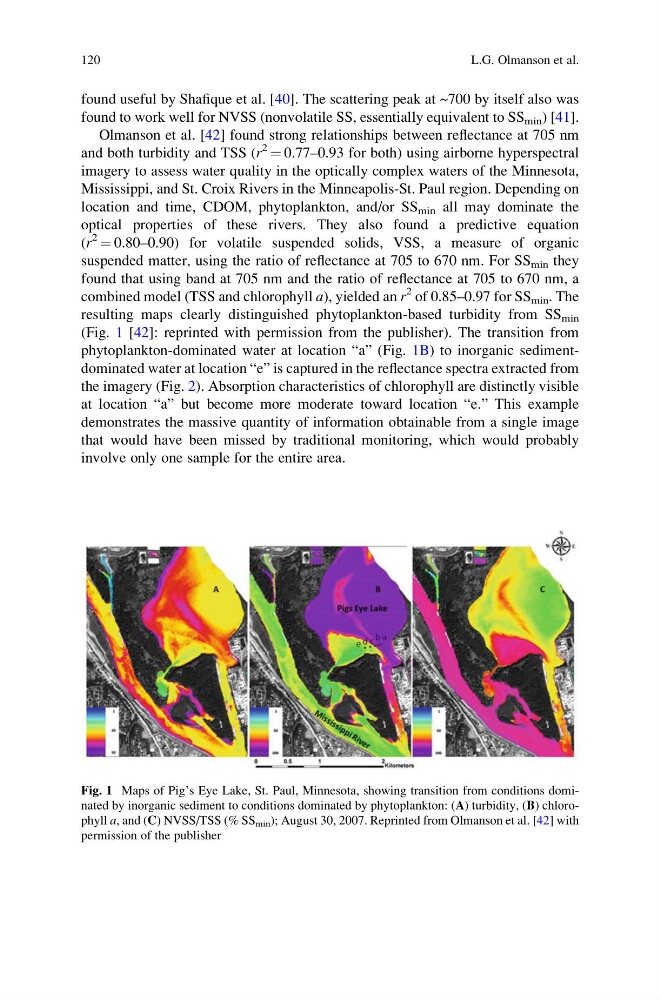
resulting maps clearly distinguished phytoplankton-based turbidity from SS min
(Fig. 1 [42]: reprinted with permission from the publisher). The transition from
phytoplankton-dominated water at location “a” (Fig. 1B) to inorganic sedimentdominated water at location “e” is captured in the reflectance spectra extracted from
the imagery (Fig. 2). Absorption characteristics of chlorophyll are distinctly visible
at location “a” but become more moderate toward location “e.” This example
demonstrates the massive quantity of information obtainable from a single image
that would have been missed by traditional monitoring, which would probably
involve only one sample for the entire area.
Fig. 1 Maps of Pig’s Eye Lake, St. Paul, Minnesota, showing transition from conditions dominated by inorganic sediment to conditions dominated by phytoplankton: (A) turbidity, (B) chlorophyll a, and (C) NVSS/TSS (% SS min ); August 30, 2007. Reprinted from Olmanson et al. [42] with
permission of the publisher
120
L.G. Olmanson et al.
found to work well for NVSS (nonvolatile SS, essentially equivalent to SS min ) [41].
Olmanson et al. [42] found strong relationships between reflectance at 705 nm
and both turbidity and TSS (r
2
¼ 0.77–0.93 for both) using airborne hyperspectral
imagery to assess water quality in the optically complex waters of the Minnesota,
Mississippi, and St. Croix Rivers in the Minneapolis-St. Paul region. Depending on
location and time, CDOM, phytoplankton, and/or SS min all may dominate the
optical properties of these rivers. They also found a predictive equation
(r
2
¼ 0.80–0.90) for volatile suspended solids, VSS, a measure of organic
suspended matter, using the ratio of reflectance at 705 to 670 nm. For SS min they
found that using band at 705 nm and the ratio of reflectance at 705 to 670 nm, a
combined model (TSS and chlorophyll a), yielded an r
2 of 0.85–0.97 for SS min . The
resulting maps clearly distinguished phytoplankton-based turbidity from SS min
(Fig. 1 [42]: reprinted with permission from the publisher). The transition from
phytoplankton-dominated water at location “a” (Fig. 1B) to inorganic sedimentdominated water at location “e” is captured in the reflectance spectra extracted from
the imagery (Fig. 2). Absorption characteristics of chlorophyll are distinctly visible
at location “a” but become more moderate toward location “e.” This example
demonstrates the massive quantity of information obtainable from a single image
that would have been missed by traditional monitoring, which would probably
involve only one sample for the entire area.
Fig. 1 Maps of Pig’s Eye Lake, St. Paul, Minnesota, showing transition from conditions dominated by inorganic sediment to conditions dominated by phytoplankton: (A) turbidity, (B) chlorophyll a, and (C) NVSS/TSS (% SS min ); August 30, 2007. Reprinted from Olmanson et al. [42] with
permission of the publisher
120
L.G. Olmanson et al.