

compared to algal bloom dynamics extracted from the MODIS temporal series data.
These included the algal bloom starting date (lake area covered by algae >50 km
2 ),
the algal bloom mean areal extent as yearly average, and the maximum monthly
area bloom extent for each year.
The temporal series (Fig. 15) shows the anomalous behavior of 2006–2007,
which marked a turning point for the Lake Taihu environmental system. This
turning point was preceded by continuous increase of TN loading during winter
and spring and an anomalous winter cropping season for 2006 (with a clear drop in
NDVI >0.5 accumulated value, compared to 2005 and pre-2005 conditions),
followed by a strong rebound in the winter crop productivity in 2007. Two distinct
patterns emerged from the analysis of environmental factors shown in Fig. 15: one
preceding the extreme blooms of 2007 and one following it. Before 2006, the algal
bloom starting date was correlated to the winter crop productivity, an increase in
winter productivity corresponded to a later HAB start. Starting with the 2006–2007
blooms, the relationship reverses (Fig. 15) and an increase in winter crop productivity corresponds to an earlier HAB start. This may be related to a shift from
nutrient-limiting conditions (TN, in particular), which controlled pre-2006 algal
blooms, to conditions of nutrient saturation (due to the simultaneous increase of
both TN and TP from 2000 to 2006), where climatic and anthropic factors (temperature and winter crop seasonality) controlled algal dynamics. After the two
extreme blooms of 2006–2007, the system appears to have stabilized, but a decrease
in TN concentrations or another extended hot season like that of 2006 could lead to
a new shift.
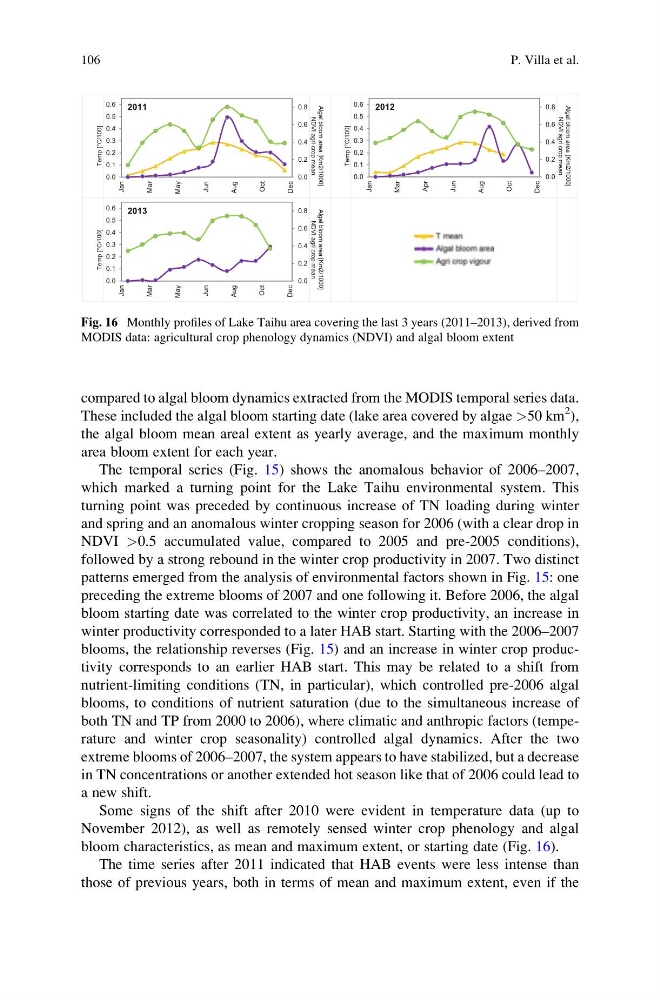
Some signs of the shift after 2010 were evident in temperature data (up to
November 2012), as well as remotely sensed winter crop phenology and algal
bloom characteristics, as mean and maximum extent, or starting date (Fig. 16).
The time series after 2011 indicated that HAB events were less intense than
those of previous years, both in terms of mean and maximum extent, even if the
Temp [°C/100]
Algal bloom area [Km2/1000]
NDVI agri crop mean
Temp [°C/100]
Algal bloom area [Km2/1000]
NDVI agri crop mean
Temp [°C/100]
Algal bloom area [Km2/1000]
NDVI agri crop mean
0.0
0.2
0.4
0.6
0.8
0.0
0.1
0.2
0.3
0.4
0.5
0.6
Jan
Mar
May
Jun
Aug
Oct
Dec
2011
0.0
0.2
0.4
0.6
0.8
0.0
0.1
0.2
0.3
0.4
0.5
0.6
Jan
Mar
Apr
Jun
Aug
Oct
Dec
2012
0.0
0.2
0.4
0.6
0.8
0.0
0.1
0.2
0.3
0.4
0.5
0.6
Jan
Mar
May
Jun
Aug
Oct
Dec
2013
Fig. 16 Monthly profiles of Lake Taihu area covering the last 3 years (2011–2013), derived from
MODIS data: agricultural crop phenology dynamics (NDVI) and algal bloom extent
106
P. Villa et al.
These included the algal bloom starting date (lake area covered by algae >50 km
2 ),
the algal bloom mean areal extent as yearly average, and the maximum monthly
area bloom extent for each year.
The temporal series (Fig. 15) shows the anomalous behavior of 2006–2007,
which marked a turning point for the Lake Taihu environmental system. This
turning point was preceded by continuous increase of TN loading during winter
and spring and an anomalous winter cropping season for 2006 (with a clear drop in
NDVI >0.5 accumulated value, compared to 2005 and pre-2005 conditions),
followed by a strong rebound in the winter crop productivity in 2007. Two distinct
patterns emerged from the analysis of environmental factors shown in Fig. 15: one
preceding the extreme blooms of 2007 and one following it. Before 2006, the algal
bloom starting date was correlated to the winter crop productivity, an increase in
winter productivity corresponded to a later HAB start. Starting with the 2006–2007
blooms, the relationship reverses (Fig. 15) and an increase in winter crop productivity corresponds to an earlier HAB start. This may be related to a shift from
nutrient-limiting conditions (TN, in particular), which controlled pre-2006 algal
blooms, to conditions of nutrient saturation (due to the simultaneous increase of
both TN and TP from 2000 to 2006), where climatic and anthropic factors (temperature and winter crop seasonality) controlled algal dynamics. After the two
extreme blooms of 2006–2007, the system appears to have stabilized, but a decrease
in TN concentrations or another extended hot season like that of 2006 could lead to
a new shift.
Some signs of the shift after 2010 were evident in temperature data (up to
November 2012), as well as remotely sensed winter crop phenology and algal
bloom characteristics, as mean and maximum extent, or starting date (Fig. 16).
The time series after 2011 indicated that HAB events were less intense than
those of previous years, both in terms of mean and maximum extent, even if the
Temp [°C/100]
Algal bloom area [Km2/1000]
NDVI agri crop mean
Temp [°C/100]
Algal bloom area [Km2/1000]
NDVI agri crop mean
Temp [°C/100]
Algal bloom area [Km2/1000]
NDVI agri crop mean
0.0
0.2
0.4
0.6
0.8
0.0
0.1
0.2
0.3
0.4
0.5
0.6
Jan
Mar
May
Jun
Aug
Oct
Dec
2011
0.0
0.2
0.4
0.6
0.8
0.0
0.1
0.2
0.3
0.4
0.5
0.6
Jan
Mar
Apr
Jun
Aug
Oct
Dec
2012
0.0
0.2
0.4
0.6
0.8
0.0
0.1
0.2
0.3
0.4
0.5
0.6
Jan
Mar
May
Jun
Aug
Oct
Dec
2013
Fig. 16 Monthly profiles of Lake Taihu area covering the last 3 years (2011–2013), derived from
MODIS data: agricultural crop phenology dynamics (NDVI) and algal bloom extent
106
P. Villa et al.