

391
The status of the lakes of Bengaluru
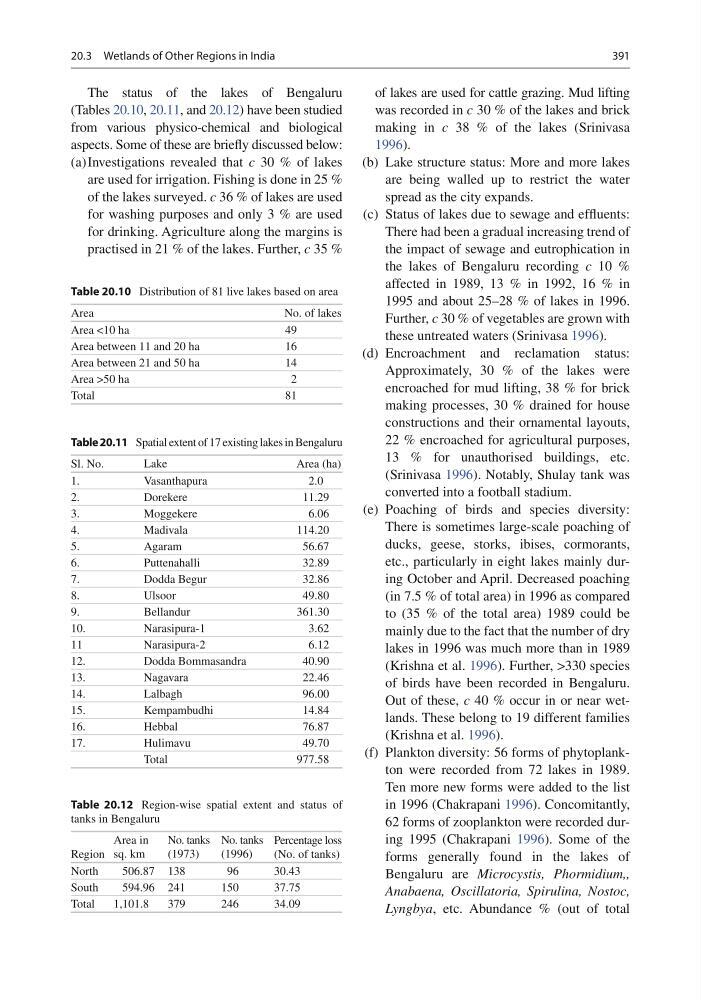
(Tables 20.10 , 20.11 , and 20.12 ) have been studied
from various physico-chemical and biological
aspects. Some of these are briefl y discussed below:
(a) Investigations revealed that c 30 % of lakes
are used for irrigation. Fishing is done in 25 %
of the lakes surveyed. c 36 % of lakes are used
for washing purposes and only 3 % are used
for drinking. Agriculture along the margins is
practised in 21 % of the lakes. Further, c 35 %
of lakes are used for cattle grazing. Mud lifting
was recorded in c 30 % of the lakes and brick
making in c 38 % of the lakes (Srinivasa
1996 ).
(b) Lake structure status: More and more lakes
are being walled up to restrict the water
spread as the city expands.
(c) Status of lakes due to sewage and effl uents:
There had been a gradual increasing trend of
the impact of sewage and eutrophication in
the lakes of Bengaluru recording c 10 %
affected in 1989, 13 % in 1992, 16 % in
1995 and about 25–28 % of lakes in 1996.
Further, c 30 % of vegetables are grown with
these untreated waters (Srinivasa 1996 ).
(d) Encroachment and reclamation status:
Approximately, 30 % of the lakes were
encroached for mud lifting, 38 % for brick
making processes, 30 % drained for house
constructions and their ornamental layouts,
22 % encroached for agricultural purposes,
13 % for unauthorised buildings, etc.
(Srinivasa 1996 ). Notably, Shulay tank was
converted into a football stadium.
(e) Poaching of birds and species diversity:
There is sometimes large-scale poaching of
ducks, geese, storks, ibises, cormorants,
etc., particularly in eight lakes mainly during October and April. Decreased poaching
(in 7.5 % of total area) in 1996 as compared
to (35 % of the total area) 1989 could be
mainly due to the fact that the number of dry
lakes in 1996 was much more than in 1989
(Krishna et al. 1996 ). Further, >330 species
of birds have been recorded in Bengaluru.
Out of these, c 40 % occur in or near wetlands. These belong to 19 different families
(Krishna et al. 1996 ).
(f) Plankton diversity: 56 forms of phytoplankton were recorded from 72 lakes in 1989.
Ten more new forms were added to the list
in 1996 (Chakrapani 1996 ). Concomitantly,
62 forms of zooplankton were recorded during 1995 (Chakrapani 1996 ). Some of the
forms generally found in the lakes of
Bengaluru are Microcystis, Phormidium,,
Anabaena, Oscillatoria, Spirulina, Nostoc,
Lyngbya , etc. Abundance % (out of total
Table 20.10 Distribution of 81 live lakes based on area
Area
No. of lakes
Area <10 ha
49
Area between 11 and 20 ha
16
Area between 21 and 50 ha
14
Area >50 ha
2
Total
81
Table 20.11 Spatial extent of 17 existing lakes in Bengaluru
Sl. No.
Lake
Area (ha)
1.
Vasanthapura
2.0
2.
Dorekere
11.29
3.
Moggekere
6.06
4.
Madivala
114.20
5.
Agaram
56.67
6.
Puttenahalli
32.89
7.
Dodda Begur
32.86
8.
Ulsoor
49.80
9.
Bellandur
361.30
10.
Narasipura-1
3.62
11
Narasipura-2
6.12
12.
Dodda Bommasandra
40.90
13.
Nagavara
22.46
14.
Lalbagh
96.00
15.
Kempambudhi
14.84
16.
Hebbal
76.87
17.
Hulimavu
49.70
Total
977.58
Table 20.12 Region-wise spatial extent and status of
tanks in Bengaluru
Region
Area in
sq. km
No. tanks
(1973)
No. tanks
(1996)
Percentage loss
(No. of tanks)
North
506.87 138
96
30.43
South
594.96 241
150
37.75
Total
1,101.8
379
246
34.09
20.3 Wetlands of Other Regions in India
The status of the lakes of Bengaluru
(Tables 20.10 , 20.11 , and 20.12 ) have been studied
from various physico-chemical and biological
aspects. Some of these are briefl y discussed below:
(a) Investigations revealed that c 30 % of lakes
are used for irrigation. Fishing is done in 25 %
of the lakes surveyed. c 36 % of lakes are used
for washing purposes and only 3 % are used
for drinking. Agriculture along the margins is
practised in 21 % of the lakes. Further, c 35 %
of lakes are used for cattle grazing. Mud lifting
was recorded in c 30 % of the lakes and brick
making in c 38 % of the lakes (Srinivasa
1996 ).
(b) Lake structure status: More and more lakes
are being walled up to restrict the water
spread as the city expands.
(c) Status of lakes due to sewage and effl uents:
There had been a gradual increasing trend of
the impact of sewage and eutrophication in
the lakes of Bengaluru recording c 10 %
affected in 1989, 13 % in 1992, 16 % in
1995 and about 25–28 % of lakes in 1996.
Further, c 30 % of vegetables are grown with
these untreated waters (Srinivasa 1996 ).
(d) Encroachment and reclamation status:
Approximately, 30 % of the lakes were
encroached for mud lifting, 38 % for brick
making processes, 30 % drained for house
constructions and their ornamental layouts,
22 % encroached for agricultural purposes,
13 % for unauthorised buildings, etc.
(Srinivasa 1996 ). Notably, Shulay tank was
converted into a football stadium.
(e) Poaching of birds and species diversity:
There is sometimes large-scale poaching of
ducks, geese, storks, ibises, cormorants,
etc., particularly in eight lakes mainly during October and April. Decreased poaching
(in 7.5 % of total area) in 1996 as compared
to (35 % of the total area) 1989 could be
mainly due to the fact that the number of dry
lakes in 1996 was much more than in 1989
(Krishna et al. 1996 ). Further, >330 species
of birds have been recorded in Bengaluru.
Out of these, c 40 % occur in or near wetlands. These belong to 19 different families
(Krishna et al. 1996 ).
(f) Plankton diversity: 56 forms of phytoplankton were recorded from 72 lakes in 1989.
Ten more new forms were added to the list
in 1996 (Chakrapani 1996 ). Concomitantly,
62 forms of zooplankton were recorded during 1995 (Chakrapani 1996 ). Some of the
forms generally found in the lakes of
Bengaluru are Microcystis, Phormidium,,
Anabaena, Oscillatoria, Spirulina, Nostoc,
Lyngbya , etc. Abundance % (out of total
Table 20.10 Distribution of 81 live lakes based on area
Area
No. of lakes
Area <10 ha
49
Area between 11 and 20 ha
16
Area between 21 and 50 ha
14
Area >50 ha
2
Total
81
Table 20.11 Spatial extent of 17 existing lakes in Bengaluru
Sl. No.
Lake
Area (ha)
1.
Vasanthapura
2.0
2.
Dorekere
11.29
3.
Moggekere
6.06
4.
Madivala
114.20
5.
Agaram
56.67
6.
Puttenahalli
32.89
7.
Dodda Begur
32.86
8.
Ulsoor
49.80
9.
Bellandur
361.30
10.
Narasipura-1
3.62
11
Narasipura-2
6.12
12.
Dodda Bommasandra
40.90
13.
Nagavara
22.46
14.
Lalbagh
96.00
15.
Kempambudhi
14.84
16.
Hebbal
76.87
17.
Hulimavu
49.70
Total
977.58
Table 20.12 Region-wise spatial extent and status of
tanks in Bengaluru
Region
Area in
sq. km
No. tanks
(1973)
No. tanks
(1996)
Percentage loss
(No. of tanks)
North
506.87 138
96
30.43
South
594.96 241
150
37.75
Total
1,101.8
379
246
34.09
20.3 Wetlands of Other Regions in India