

81
The SO( 2 concentrations in the porewater were not measured. However, the steep
concentration gradients of NI-I4 § between 0 and 10 cm depth indicates a strong SO42
reduction process in this zone.
-20
0
Ill
-"
9
80
0
20
.-. 40
E
.~ 60
.s_
o
e~
o~
e-.
g2
-20
0 9
20
40
6O
8O
0
Mn 2+ (~M)
100
200
%
I
"" 9 P043" (pM)
-20 j
Ot
20[
40t
601
801
300 0
-20 r
I
Or.
201
401
601
801
300 0
NO 3" (raM)
04 o'8
"%
9 ~ N H : (raM)
%
100
200
5
10 15 20
-20 r
OPP 9
i
201 ":
40)
9
601
,'
,"
Fe2+(mM)
80:
.2 0
1
2
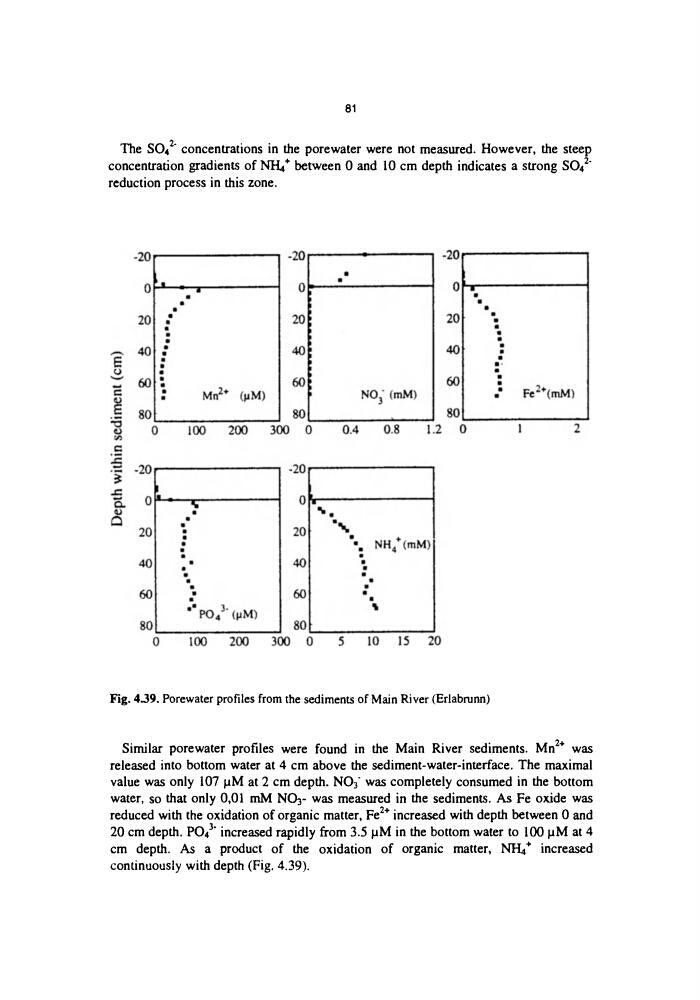
Fig. 4.39. Porewater profiles from the sediments of Main River (Erlabrunn)
Similar porewater profiles were found in the Main River sediments. Mn 2§ was
released into bottom water at 4 cm above the sediment-water-interface. The maximal
value was only 107 laM at 2 cm depth. NO3 was completely consumed in the bottom
water, so that only 0,01 mM NO3- was measured in the sediments. As Fe oxide was
reduced with the oxidation of organic matter, Fe 2§ increased with depth between 0 and
20 cm depth. PO43" increased rapidly from 3.5 laM in the bottom water to 100 laM at 4
cm depth. As a product of the oxidation of organic matter, NFI4 § increased
continuously with depth (Fig. ,*.39).
The SO( 2 concentrations in the porewater were not measured. However, the steep
concentration gradients of NI-I4 § between 0 and 10 cm depth indicates a strong SO42
reduction process in this zone.
-20
0
Ill
-"
9
80
0
20
.-. 40
E
.~ 60
.s_
o
e~
o~
e-.
g2
-20
0 9
20
40
6O
8O
0
Mn 2+ (~M)
100
200
%
I
"" 9 P043" (pM)
-20 j
Ot
20[
40t
601
801
300 0
-20 r
I
Or.
201
401
601
801
300 0
NO 3" (raM)
04 o'8
"%
9 ~ N H : (raM)
%
100
200
5
10 15 20
-20 r
OPP 9
i
201 ":
40)
9
601
,'
,"
Fe2+(mM)
80:
.2 0
1
2
Fig. 4.39. Porewater profiles from the sediments of Main River (Erlabrunn)
Similar porewater profiles were found in the Main River sediments. Mn 2§ was
released into bottom water at 4 cm above the sediment-water-interface. The maximal
value was only 107 laM at 2 cm depth. NO3 was completely consumed in the bottom
water, so that only 0,01 mM NO3- was measured in the sediments. As Fe oxide was
reduced with the oxidation of organic matter, Fe 2§ increased with depth between 0 and
20 cm depth. PO43" increased rapidly from 3.5 laM in the bottom water to 100 laM at 4
cm depth. As a product of the oxidation of organic matter, NFI4 § increased
continuously with depth (Fig. ,*.39).