

U sing Phages for Characterization of Effluent Quality in a Stabilization Pond
419
the filter) is very similar for winter and summer and never exceeds of 3 log units.
The microbial quality of the effluent complies with the WHO guidelines for
unrestricted irrigation (WHO, 1989).
u
o
350
t!
30.0
:;)
~
25 .0
GI
-
ra.
E
20.0
GI
--...
15 .0
-
-
GI
' "
~
10.0
GI
11\
5.0
' "
0.0
-
'-- ' - ,
'-- ' - ,
'-- -
-
' -
. -
' -
~
Raw
Anaerobe Focullative
Maturation Rocky pond StallollZaUon
sewage
pond
pond
pond
reservoir
I_ s..nmer (Jun.Oct 29.6
29.8
265
26.9
255
26.1
~(NOII.Mao)
225
I 221
161
14.8
14.5
14.8
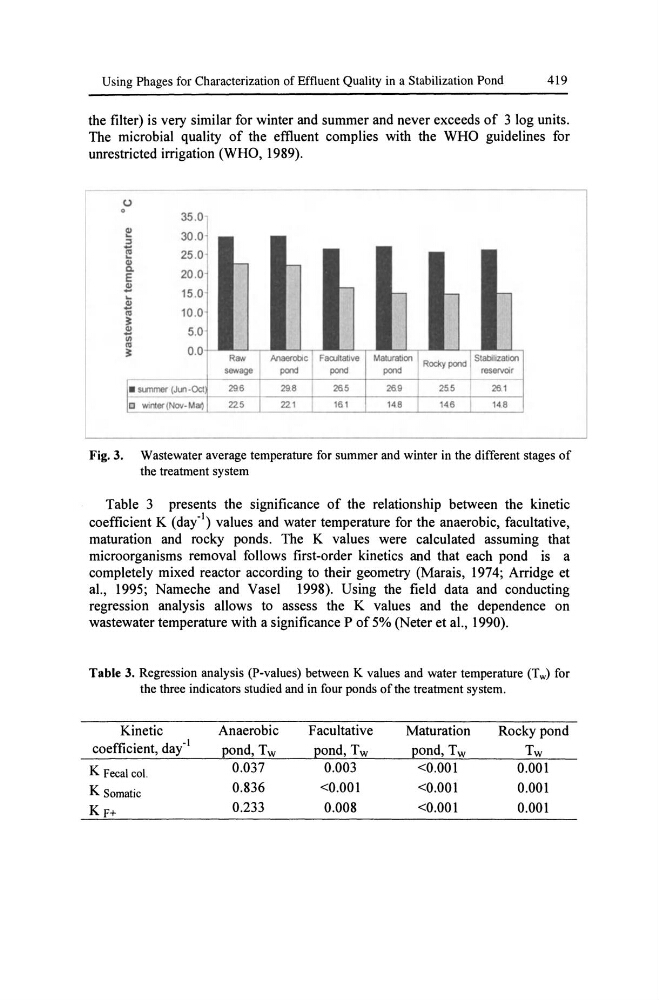
Fig. 3. Wastewater average temperature for summer and winter in the different stages of
the treatment system
Table 3 presents the significance of the relationship between the kinetic
coefficient K (day"l) values and water temperature for the anaerobic, facultative,
maturation and rocky ponds. The K values were calculated assuming that
microorganisms removal follows first-order kinetics and that each pond is a
completely mixed reactor according to their geometry (Marais, 1974; Arridge et
at., 1995; Nameche and Vasel 1998). Using the field data and conducting
regression analysis allows to assess the K values and the dependence on
wastewater temperature with a significance P of 5% (Neter et at., 1990).
Table 3. Regression analysis (P-values) between K values and water temperature (Tw) for
the three indicators studied and in four ponds of the treatment system.
Kinetic
Anaerobic
Facultative
Maturation
Rocky pond
coefficient, day"l
pond, Tw
pond, Tw
pond, Tw
Tw
K Fecal coL
0.037
0.003
<0.001
0.001
K Somatic
0.836
<0.001
<0.001
0.001
KF+
0.233
0.008
<0.001
0.001
419
the filter) is very similar for winter and summer and never exceeds of 3 log units.
The microbial quality of the effluent complies with the WHO guidelines for
unrestricted irrigation (WHO, 1989).
u
o
350
t!
30.0
:;)
~
25 .0
GI
-
ra.
E
20.0
GI
--...
15 .0
-
-
GI
' "
~
10.0
GI
11\
5.0
' "
0.0
-
'-- ' - ,
'-- ' - ,
'-- -
-
' -
. -
' -
~
Raw
Anaerobe Focullative
Maturation Rocky pond StallollZaUon
sewage
pond
pond
pond
reservoir
I_ s..nmer (Jun.Oct 29.6
29.8
265
26.9
255
26.1
~(NOII.Mao)
225
I 221
161
14.8
14.5
14.8
Fig. 3. Wastewater average temperature for summer and winter in the different stages of
the treatment system
Table 3 presents the significance of the relationship between the kinetic
coefficient K (day"l) values and water temperature for the anaerobic, facultative,
maturation and rocky ponds. The K values were calculated assuming that
microorganisms removal follows first-order kinetics and that each pond is a
completely mixed reactor according to their geometry (Marais, 1974; Arridge et
at., 1995; Nameche and Vasel 1998). Using the field data and conducting
regression analysis allows to assess the K values and the dependence on
wastewater temperature with a significance P of 5% (Neter et at., 1990).
Table 3. Regression analysis (P-values) between K values and water temperature (Tw) for
the three indicators studied and in four ponds of the treatment system.
Kinetic
Anaerobic
Facultative
Maturation
Rocky pond
coefficient, day"l
pond, Tw
pond, Tw
pond, Tw
Tw
K Fecal coL
0.037
0.003
<0.001
0.001
K Somatic
0.836
<0.001
<0.001
0.001
KF+
0.233
0.008
<0.001
0.001