

418
Alcalde et al.
Summer (June<>ctober )
o.
Raw
Mer
Mot
-
anaerobic facultahve
•
Fecal eel
678
632
598
Soma1ic
6. 63
5.82
506
!;I F+
673
5n
466
700
:J 6.00
-::
E
0
.;:
~
1.,-;
'...,
I )
~ 500
~
. .-,
"- <\00
.~
::.
...
I~ 19
~
-
0
300
l~
;:)
g
'" 200
\:.
I.;
~
100
0.00
RaN
Met:
Met:
M..AAermd
Met:
AAerfilter
-
..-oboe faaJ\aIJve rnatJ.aic>'1
pard
SIatI izaIJ()n
sto"age
-
627
5el
553
534
<\16
\98
226
• Fecal 0::1
6«1
SormIic
531
545
&41
515
4.98
4.39
324
301
1' 1 F+
620
548
& 14
4.!i2
4.13
200
110
116
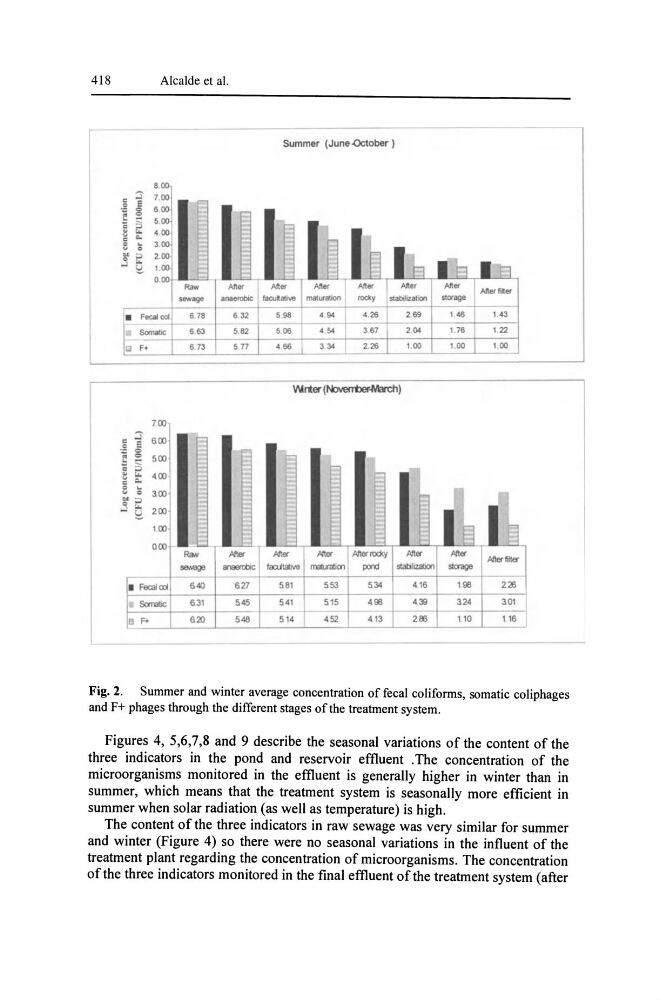
Fig. 2. Summer and winter average concentration of fecal coliforms, somatic coliphages
and F+ phages through the different stages of the treatment system.
Figures 4, 5,6,7,8 and 9 describe the seasonal variations of the content of the
three indicators in the pond and reservoir effluent . The concentration of the
microorganisms monitored in the effluent is generally higher in winter than in
summer, which means that the treatment system is seasonally more efficient in
summer when solar radiation (as well as temperature) is high.
The content of the three indicators in raw sewage was very similar for summer
and winter (Figure 4) so there were no seasonal variations in the influent of the
treatment plant regarding the concentration of microorganisms. The concentration
of the three indicators monitored in the final effluent of the treatment system (after
Alcalde et al.
Summer (June<>ctober )
o.
Raw
Mer
Mot
-
anaerobic facultahve
•
Fecal eel
678
632
598
Soma1ic
6. 63
5.82
506
!;I F+
673
5n
466
700
:J 6.00
-::
E
0
.;:
~
1.,-;
'...,
I )
~ 500
~
. .-,
"- <\00
.~
::.
...
I~ 19
~
-
0
300
l~
;:)
g
'" 200
\:.
I.;
~
100
0.00
RaN
Met:
Met:
M..AAermd
Met:
AAerfilter
-
..-oboe faaJ\aIJve rnatJ.aic>'1
pard
SIatI izaIJ()n
sto"age
-
627
5el
553
534
<\16
\98
226
• Fecal 0::1
6«1
SormIic
531
545
&41
515
4.98
4.39
324
301
1' 1 F+
620
548
& 14
4.!i2
4.13
200
110
116
Fig. 2. Summer and winter average concentration of fecal coliforms, somatic coliphages
and F+ phages through the different stages of the treatment system.
Figures 4, 5,6,7,8 and 9 describe the seasonal variations of the content of the
three indicators in the pond and reservoir effluent . The concentration of the
microorganisms monitored in the effluent is generally higher in winter than in
summer, which means that the treatment system is seasonally more efficient in
summer when solar radiation (as well as temperature) is high.
The content of the three indicators in raw sewage was very similar for summer
and winter (Figure 4) so there were no seasonal variations in the influent of the
treatment plant regarding the concentration of microorganisms. The concentration
of the three indicators monitored in the final effluent of the treatment system (after