

262
1. FUrst and H. P. Nachtnebel
uniformly distributed on the left bank (Fig. 8, right part). This trend is even
increased in the years 1997 and 1998, after the impoundment of the Danube.
40000
Er . .
ADln
Unt.,. NJ in
-
-r-- .-~t • .ADoul
-
- -
Unt.,..AOout
30000
\
II
A Vl
\. 1\ f\ N ~~
I~
~
/lit.
. J.
~
"{
~
~~ ~
~
,
"h. ~
~ ~
~
I ~
1\'
"
y
""' ~
V
"V""
\N
~ .0000
~
IN' ' "' ~ Q1. b rv ~ ~
....."".
I'-'
,.....
i'..
.~ .".,
P''''
I--"
"\r. ~
1 -~
·.0000
I
·20000
~
!
~
~
~
~
;:;
~
~
~
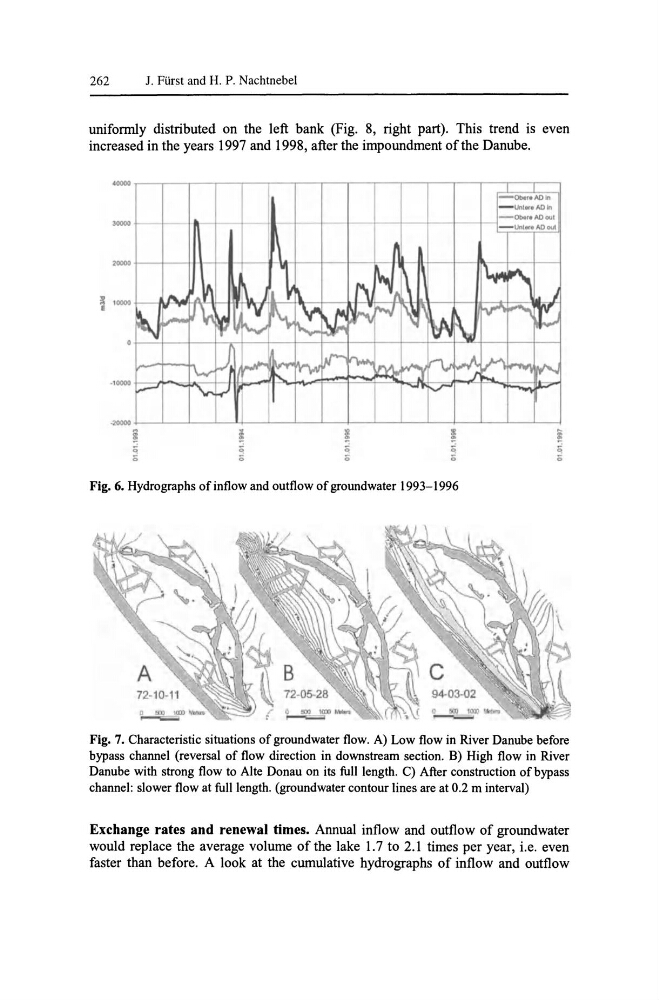
Fig. 6. Hydrographs of inflow and outflow of groundwater 1993-1996
Fig. 7. Characteristic situations of groundwater flow. A) Low flow in River Danube before
bypass channel (reversal of flow direction in downstream section. B) High flow in River
Danube with strong flow to Alte Donau on its full length. C) After construction of bypass
channel: slower flow at full length. (groundwater contour lines are at 0.2 m interval)
Exchange rates and renewal times. Annual inflow and outflow of groundwater
would replace the average volume of the lake 1.7 to 2.1 times per year, i.e. even
faster than before. A look at the cumulative hydro graphs of inflow and outflow
1. FUrst and H. P. Nachtnebel
uniformly distributed on the left bank (Fig. 8, right part). This trend is even
increased in the years 1997 and 1998, after the impoundment of the Danube.
40000
Er . .
ADln
Unt.,. NJ in
-
-r-- .-~t • .ADoul
-
- -
Unt.,..AOout
30000
\
II
A Vl
\. 1\ f\ N ~~
I~
~
/lit.
. J.
~
"{
~
~~ ~
~
,
"h. ~
~ ~
~
I ~
1\'
"
y
""' ~
V
"V""
\N
~ .0000
~
IN' ' "' ~ Q1. b rv ~ ~
....."".
I'-'
,.....
i'..
.~ .".,
P''''
I--"
"\r. ~
1 -~
·.0000
I
·20000
~
!
~
~
~
~
;:;
~
~
~
Fig. 6. Hydrographs of inflow and outflow of groundwater 1993-1996
Fig. 7. Characteristic situations of groundwater flow. A) Low flow in River Danube before
bypass channel (reversal of flow direction in downstream section. B) High flow in River
Danube with strong flow to Alte Donau on its full length. C) After construction of bypass
channel: slower flow at full length. (groundwater contour lines are at 0.2 m interval)
Exchange rates and renewal times. Annual inflow and outflow of groundwater
would replace the average volume of the lake 1.7 to 2.1 times per year, i.e. even
faster than before. A look at the cumulative hydro graphs of inflow and outflow