

Nitrate Water Pollution Risk in the Lower Jordan Valley
241
3.1.4 Fertilizer Use and Irrigation
Fertilizer use and irrigation contribute to high loads of nitrogen on soils, and to
high nitrogen leakage into the aquifers. Leakage of nitrogen into the soil depends
on the nitrogen input and application methods, soil properties, water content, and
irrigation practices.
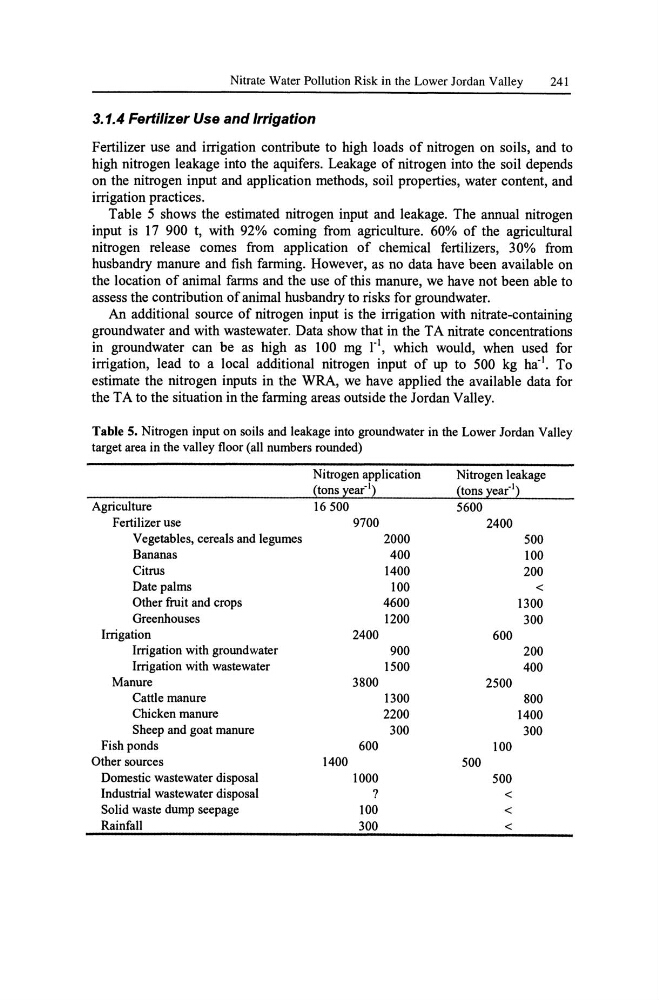
Table 5 shows the estimated nitrogen input and leakage. The annual nitrogen
input is 17 900 t, with 92% coming from agriculture. 60% of the agricultural
nitrogen release comes from application of chemical fertilizers, 30% from
husbandry manure and fish farming. However, as no data have been available on
the location of animal farms and the use of this manure, we have not been able to
assess the contribution of animal husbandry to risks for groundwater.
An additional source of nitrogen input is the irrigation with nitrate-containing
groundwater and with wastewater. Data show that in the T A nitrate concentrations
in groundwater can be as high as 100 mg rl, which would, when used for
irrigation, lead to a local additional nitrogen input of up to 500 kg ha- I . To
estimate the nitrogen inputs in the WRA, we have applied the available data for
the TA to the situation in the farming areas outside the Jordan Valley.
Table 5. Nitrogen input on soils and leakage into groundwater in the Lower Jordan Valley
target area in the valley floor (all numbers rounded)
Nitrogen application
Nitrogen leakage
(tons year-I)
(tons year-I)
Agriculture
16500
5600
Fertilizer use
9700
2400
Vegetables, cereals and legumes
2000
500
Bananas
400
100
Citrus
1400
200
Date palms
100
<
Other fruit and crops
4600
1300
Greenhouses
1200
300
Irrigation
2400
600
Irrigation with groundwater
900
200
Irrigation with wastewater
1500
400
Manure
3800
2500
Cattle manure
1300
800
Chicken manure
2200
1400
Sheep and goat manure
300
300
Fish ponds
600
100
Other sources
1400
500
Domestic wastewater disposal
1000
500
Industrial wastewater disposal
?
<
Solid waste dump seepage
100
<
Rainfall
300
<
241
3.1.4 Fertilizer Use and Irrigation
Fertilizer use and irrigation contribute to high loads of nitrogen on soils, and to
high nitrogen leakage into the aquifers. Leakage of nitrogen into the soil depends
on the nitrogen input and application methods, soil properties, water content, and
irrigation practices.
Table 5 shows the estimated nitrogen input and leakage. The annual nitrogen
input is 17 900 t, with 92% coming from agriculture. 60% of the agricultural
nitrogen release comes from application of chemical fertilizers, 30% from
husbandry manure and fish farming. However, as no data have been available on
the location of animal farms and the use of this manure, we have not been able to
assess the contribution of animal husbandry to risks for groundwater.
An additional source of nitrogen input is the irrigation with nitrate-containing
groundwater and with wastewater. Data show that in the T A nitrate concentrations
in groundwater can be as high as 100 mg rl, which would, when used for
irrigation, lead to a local additional nitrogen input of up to 500 kg ha- I . To
estimate the nitrogen inputs in the WRA, we have applied the available data for
the TA to the situation in the farming areas outside the Jordan Valley.
Table 5. Nitrogen input on soils and leakage into groundwater in the Lower Jordan Valley
target area in the valley floor (all numbers rounded)
Nitrogen application
Nitrogen leakage
(tons year-I)
(tons year-I)
Agriculture
16500
5600
Fertilizer use
9700
2400
Vegetables, cereals and legumes
2000
500
Bananas
400
100
Citrus
1400
200
Date palms
100
<
Other fruit and crops
4600
1300
Greenhouses
1200
300
Irrigation
2400
600
Irrigation with groundwater
900
200
Irrigation with wastewater
1500
400
Manure
3800
2500
Cattle manure
1300
800
Chicken manure
2200
1400
Sheep and goat manure
300
300
Fish ponds
600
100
Other sources
1400
500
Domestic wastewater disposal
1000
500
Industrial wastewater disposal
?
<
Solid waste dump seepage
100
<
Rainfall
300
<