

Nitrate Water Pollution Risk in the Lower Jordan Valley
233
The data that have been collected by the regional project partners indicate that
the water supply is around 442 mcm per year, 299 mcm (68%) with drinking
water quality. Much of the available water is imported from outside the study area
(freshwater from Yarmouk and Lake Tiberias, wastewater from the Amman urban
area). In the Jordanian water regions there is a significant water exchange, with
"imported" drinking water from the North "exported" to the Amman urban area
for domestic and public use, and (treated) wastewater redelivered for use in
agriculture.
2.2 Water Demand
The domestic and public water demand is very variable. The per-capita
consumption is 24 m 3 for Palestinians, 75 m 3 for Jordanians and 100 m 3 for
Israelis, which reflects different water utilization habits and comfort requirements,
and different levels of public services. The overall domestic and public water use
in the study area is about 21 mcm, which is only 5% of the total water usage.
Demand from industrial activities and tourism activities are below 1 mcm. By
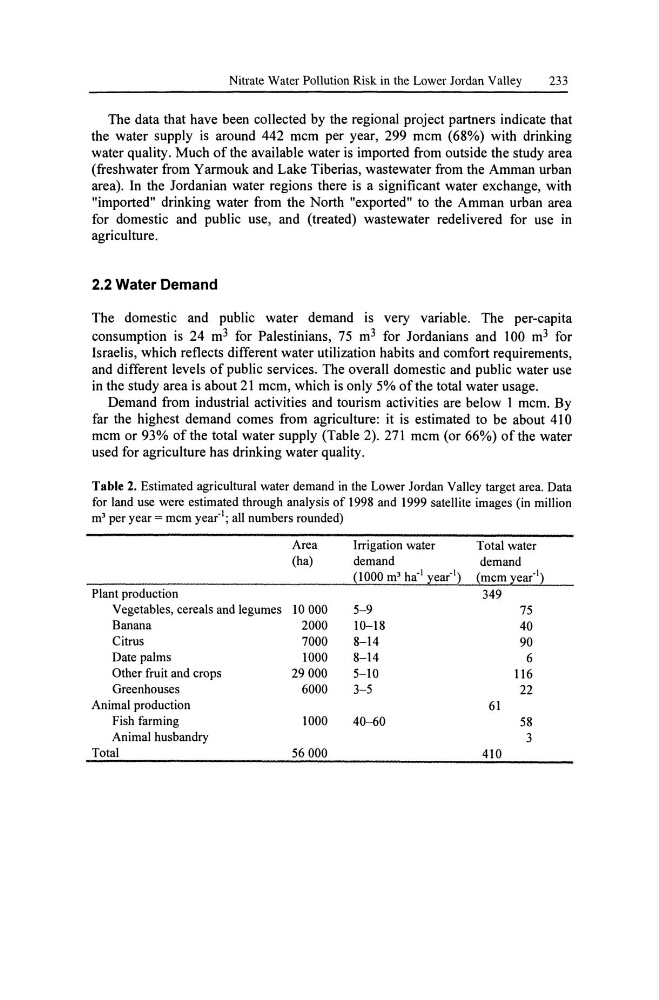
far the highest demand comes from agriculture: it is estimated to be about 410
mcm or 93% of the total water supply (Table 2).271 mcm (or 66%) of the water
used for agriculture has drinking water quality.
Table 2. Estimated agricultural water demand in the Lower Jordan Valley target area. Data
for land use were estimated through analysis of 1998 and 1999 satellite images (in million
m 3 per year = mcm yea(l; all numbers rounded)
Area
Irrigation water
Total water
(ha)
demand
demand
(1000 m 3 ha· l year· l ) (mcm year· l )
Plant production
349
Vegetables, cereals and legumes 10000
5-9
75
Banana
2000
10-18
40
Citrus
7000
8-14
90
Date palms
1000
8-14
6
Other fruit and crops
29000
5-10
116
Greenhouses
6000
3-5
22
Animal production
61
Fish farming
1000
40--60
58
Animal husbandry
3
Total
56000
410
233
The data that have been collected by the regional project partners indicate that
the water supply is around 442 mcm per year, 299 mcm (68%) with drinking
water quality. Much of the available water is imported from outside the study area
(freshwater from Yarmouk and Lake Tiberias, wastewater from the Amman urban
area). In the Jordanian water regions there is a significant water exchange, with
"imported" drinking water from the North "exported" to the Amman urban area
for domestic and public use, and (treated) wastewater redelivered for use in
agriculture.
2.2 Water Demand
The domestic and public water demand is very variable. The per-capita
consumption is 24 m 3 for Palestinians, 75 m 3 for Jordanians and 100 m 3 for
Israelis, which reflects different water utilization habits and comfort requirements,
and different levels of public services. The overall domestic and public water use
in the study area is about 21 mcm, which is only 5% of the total water usage.
Demand from industrial activities and tourism activities are below 1 mcm. By
far the highest demand comes from agriculture: it is estimated to be about 410
mcm or 93% of the total water supply (Table 2).271 mcm (or 66%) of the water
used for agriculture has drinking water quality.
Table 2. Estimated agricultural water demand in the Lower Jordan Valley target area. Data
for land use were estimated through analysis of 1998 and 1999 satellite images (in million
m 3 per year = mcm yea(l; all numbers rounded)
Area
Irrigation water
Total water
(ha)
demand
demand
(1000 m 3 ha· l year· l ) (mcm year· l )
Plant production
349
Vegetables, cereals and legumes 10000
5-9
75
Banana
2000
10-18
40
Citrus
7000
8-14
90
Date palms
1000
8-14
6
Other fruit and crops
29000
5-10
116
Greenhouses
6000
3-5
22
Animal production
61
Fish farming
1000
40--60
58
Animal husbandry
3
Total
56000
410