

232
R. Orthofer and W. Loibl
the WRA only few data were available for the east of the River Jordan. Because of
the highly uncertain data, the risk assessment follows a binary or fuzzy
classification (such as no/low risk, possible/medium risk, high risk) for the
groundwater that supplies wells and springs in the T A.
2 Water Usage in the Lower Jordan Valley
2.1 Water Supply
The Lower Jordan Valley has a transitional arid climate, between dry steppe and
extreme desert conditions of the Dead Sea region. The annual pan evaporation is
about 1500-2500 mm while the annual precipitation is only 50-250 mm. We have
estimated the (theoretical) locally renewable water supply from rainfall to be 49
million m 3 (mcm), which is about 30% of all winter rain. Present human activities
can only be sustained with water that is supplied from outside the valley, or with
water from local springs and wells that have their recharge area outside the valley.
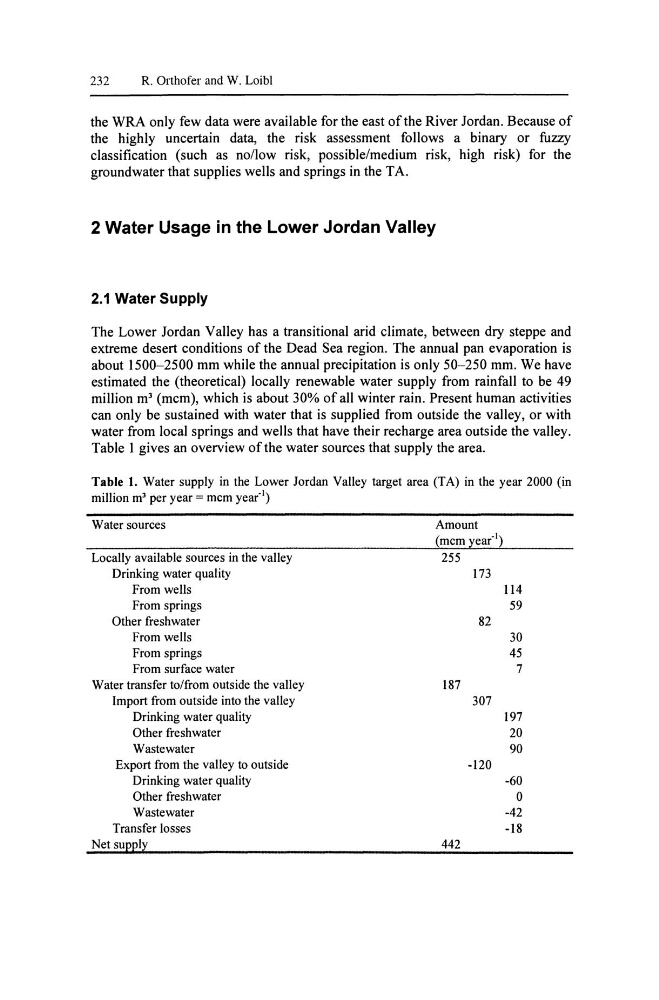
Table 1 gives an overview of the water sources that supply the area.
Table 1. Water supply in the Lower Jordan Valley target area (TA) in the year 2000 (in
million m 3 per year = mcm year"l)
Water sources
Amount
(mcm year"l)
Locally available sources in the valley
255
Drinking water quality
173
From wells
114
From springs
59
Other freshwater
82
From wells
30
From springs
45
From surface water
7
Water transfer to/from outside the valley
187
Import from outside into the valley
307
Drinking water quality
197
Other freshwater
20
Wastewater
90
Export from the valley to outside
-120
Drinking water quality
-60
Other freshwater
0
Wastewater
-42
Transfer losses
-18
Net supply
442
R. Orthofer and W. Loibl
the WRA only few data were available for the east of the River Jordan. Because of
the highly uncertain data, the risk assessment follows a binary or fuzzy
classification (such as no/low risk, possible/medium risk, high risk) for the
groundwater that supplies wells and springs in the T A.
2 Water Usage in the Lower Jordan Valley
2.1 Water Supply
The Lower Jordan Valley has a transitional arid climate, between dry steppe and
extreme desert conditions of the Dead Sea region. The annual pan evaporation is
about 1500-2500 mm while the annual precipitation is only 50-250 mm. We have
estimated the (theoretical) locally renewable water supply from rainfall to be 49
million m 3 (mcm), which is about 30% of all winter rain. Present human activities
can only be sustained with water that is supplied from outside the valley, or with
water from local springs and wells that have their recharge area outside the valley.
Table 1 gives an overview of the water sources that supply the area.
Table 1. Water supply in the Lower Jordan Valley target area (TA) in the year 2000 (in
million m 3 per year = mcm year"l)
Water sources
Amount
(mcm year"l)
Locally available sources in the valley
255
Drinking water quality
173
From wells
114
From springs
59
Other freshwater
82
From wells
30
From springs
45
From surface water
7
Water transfer to/from outside the valley
187
Import from outside into the valley
307
Drinking water quality
197
Other freshwater
20
Wastewater
90
Export from the valley to outside
-120
Drinking water quality
-60
Other freshwater
0
Wastewater
-42
Transfer losses
-18
Net supply
442