

142
U. Shavit et al.
The ol1B values of the Jordan River show relatively constant values of 29 to
33%0 (except one sample with 37%0). These values are in contrast to the relatively
higher ol1B values of the western inflows and groundwater. They also contradict
the large elemental boron variations that follow those of CI changes along the
different zones of the river. The relatively constant low 011B values of the Jordan
River can be explained by (1) desorption processes that take place in the
hyporheic zone and/or (2) overlaps in 011B signatures of the different salinity
sources. The high correlation between elemental Band CI favors the latter
explanation. Nevertheless, the inconsistency between the measured ol1B values of
the apparent inflow saline sources, particularly in the southern zone (ol1B = 40 to
43%0) and the low ol1B of the Jordan River is not resolved.
3.2 Flow-Rate Measurements
Velocity measurements were obtained in several cross-sections along the north
part of the river, its western and eastern tributaries. This chapter covers
preliminary results obtained between Dec. 2000 and March 2001. During the
measurements, water level along the river was monitored and pumping discharge
volumes were reported by the relevant stations. Flow-rate was obtained by
integrating the velocity over the river/stream cross-section. At each location,
bottom profile and cross-section velocities were collected.
In the following we demonstrate the flow-rate calculation procedure at the
Dalhamiya cross-section (Fig. 14). Velocity was obtained at 30 marked locations
as shown. The velocity at each location is an average of at least 2000
measurements (pings). Vertical velocities profiles were extrapolated using a power
law model, u = az m , where u is the velocity component normal to river crosssection, z is the height from the river bed, and a and m are constants. Following
Gonzalez et al. (1996), m is 1/6 where a was computed by a least-squares curve
fitting. A comparison between the fitted 116 power law and measured velocity
(Dec. 2000) in three representing profiles is shown in Fig. 15. Flow-rate was
computed by an integration of the velocity across the river cross-section,
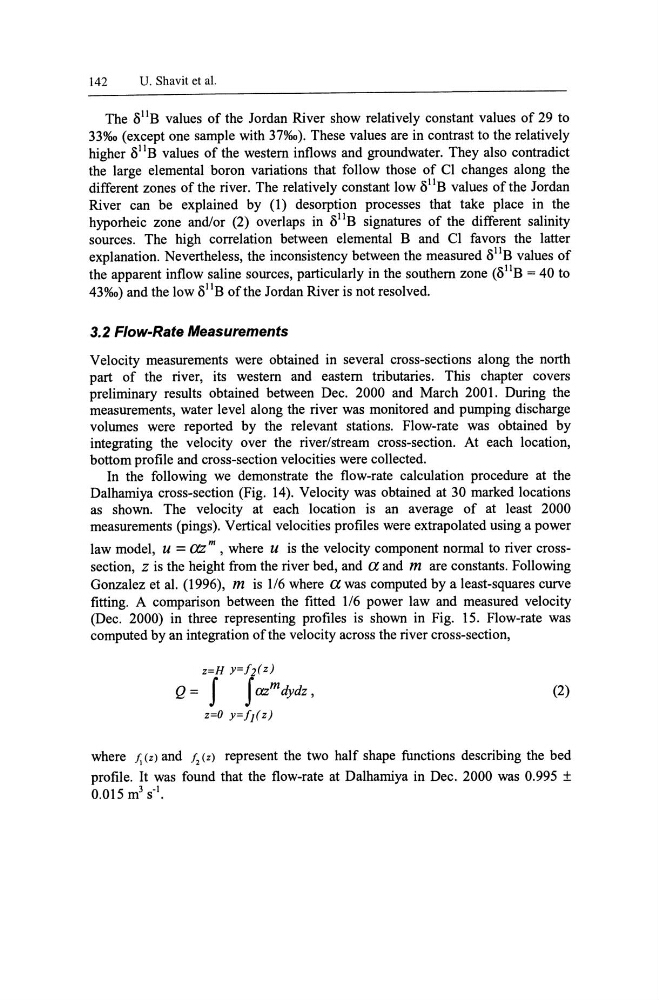
z=H y=h(z)
Q= J Jazmdydz,
z=O y=f](z)
(2)
where t.. (z) and 12 (z) represent the two half shape functions describing the bed
profile. It was found that the flow-rate at Dalhamiya in Dec. 2000 was 0.995 ±
0.015 m 3 S·I.
U. Shavit et al.
The ol1B values of the Jordan River show relatively constant values of 29 to
33%0 (except one sample with 37%0). These values are in contrast to the relatively
higher ol1B values of the western inflows and groundwater. They also contradict
the large elemental boron variations that follow those of CI changes along the
different zones of the river. The relatively constant low 011B values of the Jordan
River can be explained by (1) desorption processes that take place in the
hyporheic zone and/or (2) overlaps in 011B signatures of the different salinity
sources. The high correlation between elemental Band CI favors the latter
explanation. Nevertheless, the inconsistency between the measured ol1B values of
the apparent inflow saline sources, particularly in the southern zone (ol1B = 40 to
43%0) and the low ol1B of the Jordan River is not resolved.
3.2 Flow-Rate Measurements
Velocity measurements were obtained in several cross-sections along the north
part of the river, its western and eastern tributaries. This chapter covers
preliminary results obtained between Dec. 2000 and March 2001. During the
measurements, water level along the river was monitored and pumping discharge
volumes were reported by the relevant stations. Flow-rate was obtained by
integrating the velocity over the river/stream cross-section. At each location,
bottom profile and cross-section velocities were collected.
In the following we demonstrate the flow-rate calculation procedure at the
Dalhamiya cross-section (Fig. 14). Velocity was obtained at 30 marked locations
as shown. The velocity at each location is an average of at least 2000
measurements (pings). Vertical velocities profiles were extrapolated using a power
law model, u = az m , where u is the velocity component normal to river crosssection, z is the height from the river bed, and a and m are constants. Following
Gonzalez et al. (1996), m is 1/6 where a was computed by a least-squares curve
fitting. A comparison between the fitted 116 power law and measured velocity
(Dec. 2000) in three representing profiles is shown in Fig. 15. Flow-rate was
computed by an integration of the velocity across the river cross-section,
z=H y=h(z)
Q= J Jazmdydz,
z=O y=f](z)
(2)
where t.. (z) and 12 (z) represent the two half shape functions describing the bed
profile. It was found that the flow-rate at Dalhamiya in Dec. 2000 was 0.995 ±
0.015 m 3 S·I.