

3000
2500
~
g
2000
- U 1500
1000
Water Sources and Quality Along the Lower Jordan River
135
_March-OO
___ May-OO
~--= ___ --j -A- Aug-OO
0
20
•
Sept-OO
--e- 'Dec-OO
-13- 'Feb-Ol
40
60
Distance from Alumot (km)
80
100
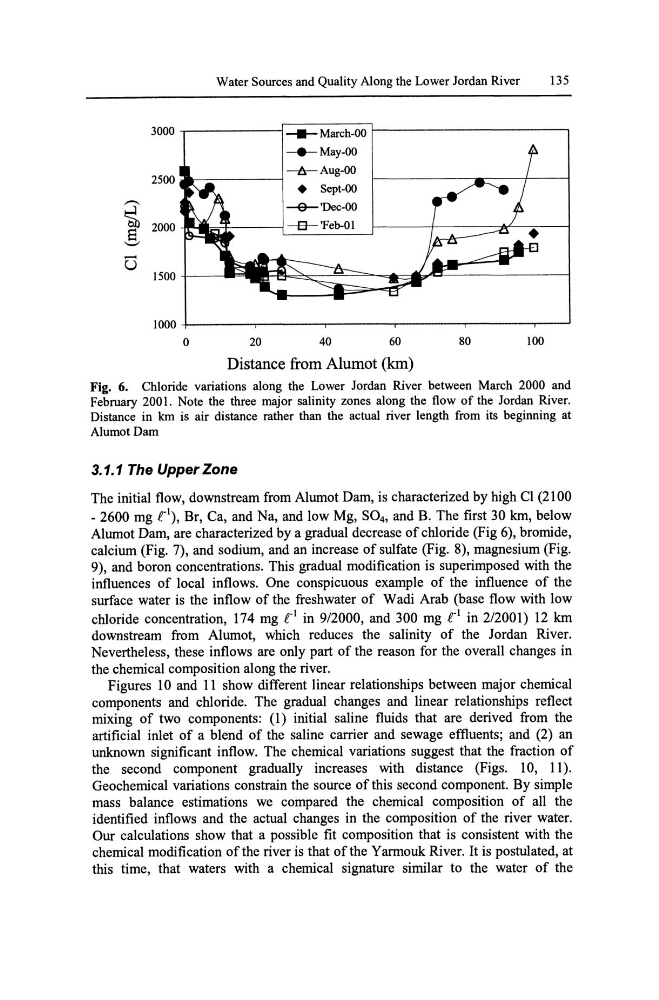
Fig. 6. Chloride variations along the Lower Jordan River between March 2000 and
February 2001. Note the three major salinity zones along the flow of the Jordan River.
Distance in Ian is air distance rather than the actual river length from its beginning at
AlumotDam
3.1.1 The Upper Zone
The initial flow, downstream from Alumot Dam, is characterized by high CI (2100
- 2600 mg It\ Br, Ca, and Na, and low Mg, 804, and B. The first 30 kIn, below
Alumot Dam, are characterized by a gradual decrease of chloride (Fig 6), bromide,
calcium (Fig. 7), and sodium, and an increase of sulfate (Fig. 8), magnesium (Fig.
9), and boron concentrations. This gradual modification is superimposed with the
influences of local inflows. One conspicuous example of the influence of the
surface water is the inflow of the freshwater of Wadi Arab (base flow with low
chloride concentration, 174 mg Itl in 9/2000, and 300 mg Itl in 2/2001) 12 kIn
downstream from Alumot, which reduces the salinity of the Jordan River.
Nevertheless, these inflows are only part of the reason for the overall changes in
the chemical composition along the river.
Figures 10 and 11 show different linear relationships between major chemical
components and chloride. The gradual changes and linear relationships reflect
mixing of two components: (1) initial saline fluids that are derived from the
artificial inlet of a blend of the saline carrier and sewage effluents; and (2) an
unknown significant inflow. The chemical variations suggest that the fraction of
the second component gradually increases with distance (Figs. 10, 11).
Geochemical variations constrain the source of this second component. By simple
mass balance estimations we compared the chemical composition of all the
identified inflows and the actual changes in the composition of the river water.
Our calculations show that a possible fit composition that is consistent with the
chemical modification of the river is that of the Yarmouk River. It is postulated, at
this time, that waters with a chemical signature similar to the water of the
2500
~
g
2000
- U 1500
1000
Water Sources and Quality Along the Lower Jordan River
135
_March-OO
___ May-OO
~--= ___ --j -A- Aug-OO
0
20
•
Sept-OO
--e- 'Dec-OO
-13- 'Feb-Ol
40
60
Distance from Alumot (km)
80
100
Fig. 6. Chloride variations along the Lower Jordan River between March 2000 and
February 2001. Note the three major salinity zones along the flow of the Jordan River.
Distance in Ian is air distance rather than the actual river length from its beginning at
AlumotDam
3.1.1 The Upper Zone
The initial flow, downstream from Alumot Dam, is characterized by high CI (2100
- 2600 mg It\ Br, Ca, and Na, and low Mg, 804, and B. The first 30 kIn, below
Alumot Dam, are characterized by a gradual decrease of chloride (Fig 6), bromide,
calcium (Fig. 7), and sodium, and an increase of sulfate (Fig. 8), magnesium (Fig.
9), and boron concentrations. This gradual modification is superimposed with the
influences of local inflows. One conspicuous example of the influence of the
surface water is the inflow of the freshwater of Wadi Arab (base flow with low
chloride concentration, 174 mg Itl in 9/2000, and 300 mg Itl in 2/2001) 12 kIn
downstream from Alumot, which reduces the salinity of the Jordan River.
Nevertheless, these inflows are only part of the reason for the overall changes in
the chemical composition along the river.
Figures 10 and 11 show different linear relationships between major chemical
components and chloride. The gradual changes and linear relationships reflect
mixing of two components: (1) initial saline fluids that are derived from the
artificial inlet of a blend of the saline carrier and sewage effluents; and (2) an
unknown significant inflow. The chemical variations suggest that the fraction of
the second component gradually increases with distance (Figs. 10, 11).
Geochemical variations constrain the source of this second component. By simple
mass balance estimations we compared the chemical composition of all the
identified inflows and the actual changes in the composition of the river water.
Our calculations show that a possible fit composition that is consistent with the
chemical modification of the river is that of the Yarmouk River. It is postulated, at
this time, that waters with a chemical signature similar to the water of the