

Numerical Simulation as a Tool to Improve Subsurface Flow
95
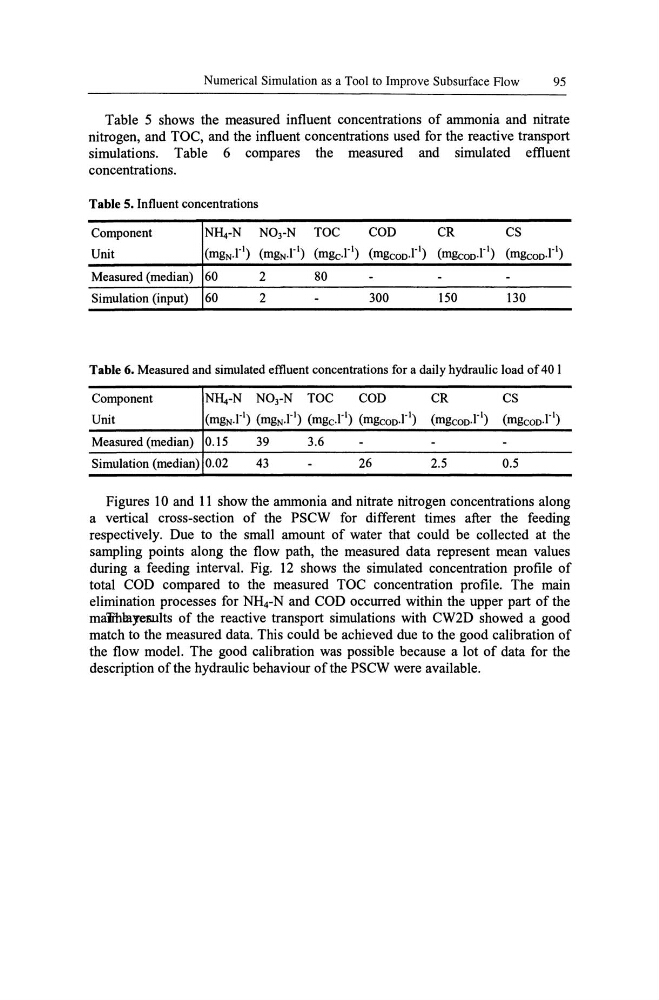
Table 5 shows the measured influent concentrations of ammonia and nitrate
nitrogen, and TOe, and the influent concentrations used for the reactive transport
simulations. Table 6 compares the measured and simulated effluent
concentrations.
Table 5. Influent concentrations
Component
Unit
Measured (median)
Simulation (input)
60
60
2
80
2
300
150
130
Table 6. Measured and simulated effluent concentrations for a daily hydraulic load of 40 I
Component
Nf4-N N03-N TOC
COD
CR
CS
Unit
(mgN.r 1 ) (mgN.r 1 ) (mgc.rl) (mgcoo.rl) (mgcoo.l· 1 ) (mgcoo.rl)
Measured (median) 0.15
39
3.6
Simulation (median) 0.02
43
26
2.5
0.5
Figures 10 and 11 show the ammonia and nitrate nitrogen concentrations along
a vertical cross-section of the PSCW for different times after the feeding
respectively. Due to the small amount of water that could be collected at the
sampling points along the flow path, the measured data represent mean values
during a feeding interval. Fig. 12 shows the simulated concentration profile of
total COD compared to the measured Toe concentration profile. The main
elimination processes for NH4-N and COD occurred within the upper part of the
maDblayesults of the reactive transport simulations with CW2D showed a good
match to the measured data. This could be achieved due to the good calibration of
the flow model. The good calibration was possible because a lot of data for the
description of the hydraulic behaviour ofthe PSCW were available.
95
Table 5 shows the measured influent concentrations of ammonia and nitrate
nitrogen, and TOe, and the influent concentrations used for the reactive transport
simulations. Table 6 compares the measured and simulated effluent
concentrations.
Table 5. Influent concentrations
Component
Unit
Measured (median)
Simulation (input)
60
60
2
80
2
300
150
130
Table 6. Measured and simulated effluent concentrations for a daily hydraulic load of 40 I
Component
Nf4-N N03-N TOC
COD
CR
CS
Unit
(mgN.r 1 ) (mgN.r 1 ) (mgc.rl) (mgcoo.rl) (mgcoo.l· 1 ) (mgcoo.rl)
Measured (median) 0.15
39
3.6
Simulation (median) 0.02
43
26
2.5
0.5
Figures 10 and 11 show the ammonia and nitrate nitrogen concentrations along
a vertical cross-section of the PSCW for different times after the feeding
respectively. Due to the small amount of water that could be collected at the
sampling points along the flow path, the measured data represent mean values
during a feeding interval. Fig. 12 shows the simulated concentration profile of
total COD compared to the measured Toe concentration profile. The main
elimination processes for NH4-N and COD occurred within the upper part of the
maDblayesults of the reactive transport simulations with CW2D showed a good
match to the measured data. This could be achieved due to the good calibration of
the flow model. The good calibration was possible because a lot of data for the
description of the hydraulic behaviour ofthe PSCW were available.