

94
G. Langergraber et al.
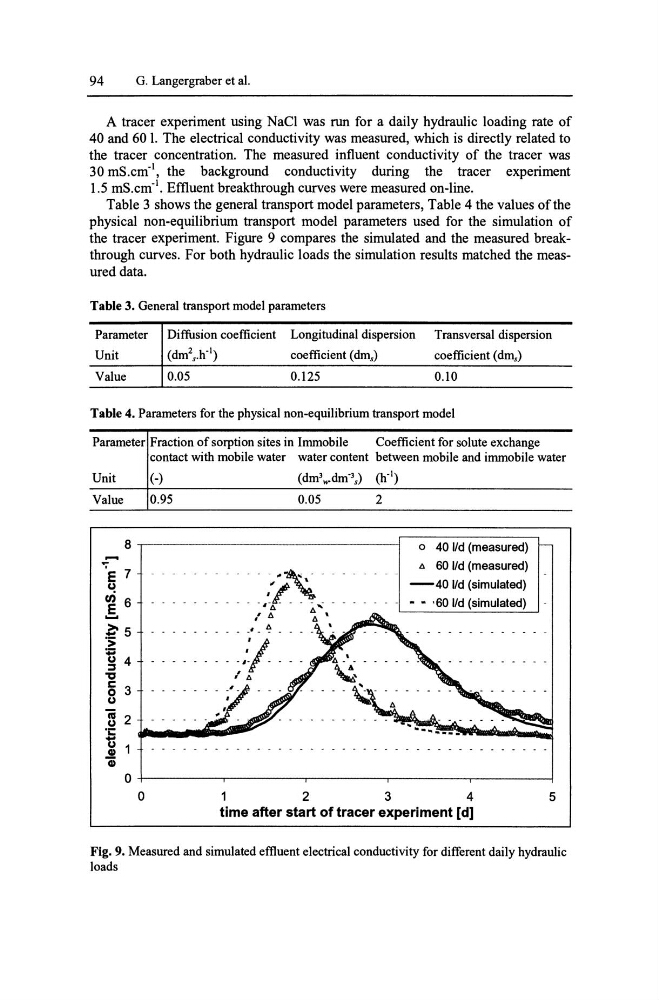
A tracer experiment using NaCI was run for a daily hydraulic loading rate of
40 and 60 1. The electrical conductivity was measured, which is directly related to
the tracer concentration. The measured influent conductivity of the tracer was
30 mS.cm- l , the background conductivity during the tracer experiment
1.5 mS.cm- l . Effluent breakthrough curves were measured on-line.
Table 3 shows the general transport model parameters, Table 4 the values of the
physical non-equilibrium transport model parameters used for the simulation of
the tracer experiment. Figure 9 compares the simulated and the measured breakthrough curves. For both hydraulic loads the simulation results matched the measured data.
Table 3. General transport model parameters
Parameter
Unit
Value
Diffusion coefficient
(dm 2 s.h- l )
0.05
Longitudinal dispersion
coefficient (dms)
0.125
Transversal dispersion
coefficient (dms)
0.10
Table 4. Parameters for the physical non-equilibrium transport model
Parameter Fraction of sorption sites in Immobile
Coefficient for solute exchange
Unit
Value
8
....
- E 7
u
en 6
E
......
~5
>
t; 4
:::J
'tJ
C 3
0
u
"iii 2
u
.;:
- U GI
Gi
0
0
contact with mobile water water content between mobile and immobile water
(-)
0.95
(dm3 w-dm-3s) (h- I )
0.05
2
o 40 lId (measured)
il.
60 lId (measured)
-40 lId (simulated)
- - ·SO lId (simulated)
2 3 4
time after start of tracer experiment [d]
5
Fig. 9. Measured and simulated effluent electrical conductivity for different daily hydraulic
loads
G. Langergraber et al.
A tracer experiment using NaCI was run for a daily hydraulic loading rate of
40 and 60 1. The electrical conductivity was measured, which is directly related to
the tracer concentration. The measured influent conductivity of the tracer was
30 mS.cm- l , the background conductivity during the tracer experiment
1.5 mS.cm- l . Effluent breakthrough curves were measured on-line.
Table 3 shows the general transport model parameters, Table 4 the values of the
physical non-equilibrium transport model parameters used for the simulation of
the tracer experiment. Figure 9 compares the simulated and the measured breakthrough curves. For both hydraulic loads the simulation results matched the measured data.
Table 3. General transport model parameters
Parameter
Unit
Value
Diffusion coefficient
(dm 2 s.h- l )
0.05
Longitudinal dispersion
coefficient (dms)
0.125
Transversal dispersion
coefficient (dms)
0.10
Table 4. Parameters for the physical non-equilibrium transport model
Parameter Fraction of sorption sites in Immobile
Coefficient for solute exchange
Unit
Value
8
....
- E 7
u
en 6
E
......
~5
>
t; 4
:::J
'tJ
C 3
0
u
"iii 2
u
.;:
- U GI
Gi
0
0
contact with mobile water water content between mobile and immobile water
(-)
0.95
(dm3 w-dm-3s) (h- I )
0.05
2
o 40 lId (measured)
il.
60 lId (measured)
-40 lId (simulated)
- - ·SO lId (simulated)
2 3 4
time after start of tracer experiment [d]
5
Fig. 9. Measured and simulated effluent electrical conductivity for different daily hydraulic
loads