

218
Phytoplankton
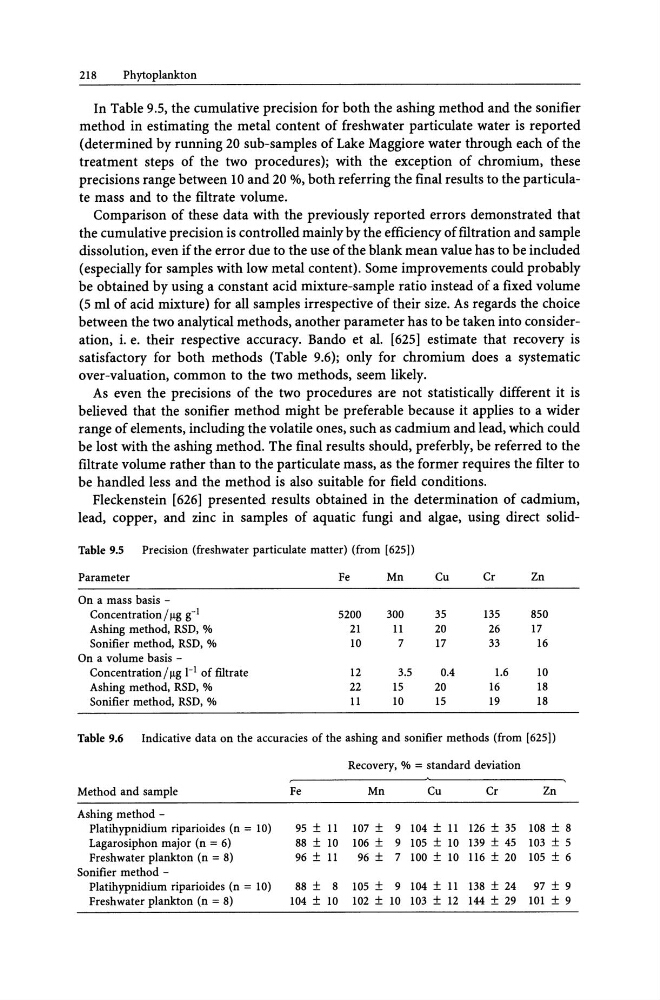
In Table 9.5, the cumulative precision for both the ashing method and the sonifier
method in estimating the metal content of freshwater particulate water is reported
(determined by running 20 sub-samples of Lake Maggiore water through each of the
treatment steps of the two procedures); with the exception of chromium, these
precisions range between 10 and 20 %, both referring the final results to the particulate mass and to the filtrate volume.
Comparison of these data with the previously reported errors demonstrated that
the cumulative precision is controlled mainly by the efficiency of filtration and sample
dissolution, even if the error due to the use of the blank mean value has to be included
(especially for samples with low metal content). Some improvements could probably
be obtained by using a constant acid mixture-sample ratio instead of a fixed volume
(5 ml of acid mixture) for all samples irrespective of their size. As regards the choice
between the two analytical methods, another parameter has to be taken into consideration, i. e. their respective accuracy. Bando et al. [625] estimate that recovery is
satisfactory for both methods (Table 9.6); only for chromium does a systematic
over-valuation, common to the two methods, seem likely.
As even the precisions of the two procedures are not statistically different it is
believed that the sonifier method might be preferable because it applies to a wider
range of elements, including the volatile ones, such as cadmium and lead, which could
be lost with the ashing method. The final results should, preferbly, be referred to the
filtrate volume rather than to the particulate mass, as the former requires the filter to
be handled less and the method is also suitable for field conditions.
Fleckenstein [626] presented results obtained in the determination of cadmium,
lead, copper, and zinc in samples of aquatic fungi and algae, using direct solidTable 9.5
Precision (freshwater particulate matter) (from [625])
Parameter
Fe
Mn
Cu
Cr
Zn
On a mass basis -
Concentration/~ g-I
5200
300
35
135
850
Ashing method, RSD, %
21
11
20
26
17
Sonifier method, RSD, %
10
7
17
33
16
On a volume basis -
Concentration/!.lg I-I of fIltrate
12
3.5
0.4
1.6
10
Ashing method, RSD, %
22
15
20
16
18
Sonifier method, RSD, %
11
10
15
19
18
Table 9.6
Indicative data on the accuracies of the ashing and sonifier methods (from [625])
Recovery, % = standard deviation
Method and sample
Fe
Mn
Cu
Cr
Zn
Ashing method -
Platihypnidium riparioides (n = 10)
95 ± 11 107 ± 9 104 ± 11 126 ± 35 108 ± 8
Lagarosiphon major (n = 6)
88 ± 10 106 ± 9 105 ± 10 139 ± 45 103 ± 5
Freshwater plankton (n = 8)
96 ± 11 96 ± 7 100 ± 10 116 ± 20 105 ± 6
Sonifier method -
Platihypnidium riparioides (n = 10)
88 ± 8 105 ± 9 104 ± 11 138 ± 24 97 ± 9
Freshwater plankton (n = 8)
104 ± 10 102 ± 10 103 ± 12 144 ± 29 101 ± 9
Phytoplankton
In Table 9.5, the cumulative precision for both the ashing method and the sonifier
method in estimating the metal content of freshwater particulate water is reported
(determined by running 20 sub-samples of Lake Maggiore water through each of the
treatment steps of the two procedures); with the exception of chromium, these
precisions range between 10 and 20 %, both referring the final results to the particulate mass and to the filtrate volume.
Comparison of these data with the previously reported errors demonstrated that
the cumulative precision is controlled mainly by the efficiency of filtration and sample
dissolution, even if the error due to the use of the blank mean value has to be included
(especially for samples with low metal content). Some improvements could probably
be obtained by using a constant acid mixture-sample ratio instead of a fixed volume
(5 ml of acid mixture) for all samples irrespective of their size. As regards the choice
between the two analytical methods, another parameter has to be taken into consideration, i. e. their respective accuracy. Bando et al. [625] estimate that recovery is
satisfactory for both methods (Table 9.6); only for chromium does a systematic
over-valuation, common to the two methods, seem likely.
As even the precisions of the two procedures are not statistically different it is
believed that the sonifier method might be preferable because it applies to a wider
range of elements, including the volatile ones, such as cadmium and lead, which could
be lost with the ashing method. The final results should, preferbly, be referred to the
filtrate volume rather than to the particulate mass, as the former requires the filter to
be handled less and the method is also suitable for field conditions.
Fleckenstein [626] presented results obtained in the determination of cadmium,
lead, copper, and zinc in samples of aquatic fungi and algae, using direct solidTable 9.5
Precision (freshwater particulate matter) (from [625])
Parameter
Fe
Mn
Cu
Cr
Zn
On a mass basis -
Concentration/~ g-I
5200
300
35
135
850
Ashing method, RSD, %
21
11
20
26
17
Sonifier method, RSD, %
10
7
17
33
16
On a volume basis -
Concentration/!.lg I-I of fIltrate
12
3.5
0.4
1.6
10
Ashing method, RSD, %
22
15
20
16
18
Sonifier method, RSD, %
11
10
15
19
18
Table 9.6
Indicative data on the accuracies of the ashing and sonifier methods (from [625])
Recovery, % = standard deviation
Method and sample
Fe
Mn
Cu
Cr
Zn
Ashing method -
Platihypnidium riparioides (n = 10)
95 ± 11 107 ± 9 104 ± 11 126 ± 35 108 ± 8
Lagarosiphon major (n = 6)
88 ± 10 106 ± 9 105 ± 10 139 ± 45 103 ± 5
Freshwater plankton (n = 8)
96 ± 11 96 ± 7 100 ± 10 116 ± 20 105 ± 6
Sonifier method -
Platihypnidium riparioides (n = 10)
88 ± 8 105 ± 9 104 ± 11 138 ± 24 97 ± 9
Freshwater plankton (n = 8)
104 ± 10 102 ± 10 103 ± 12 144 ± 29 101 ± 9