

132
Fish
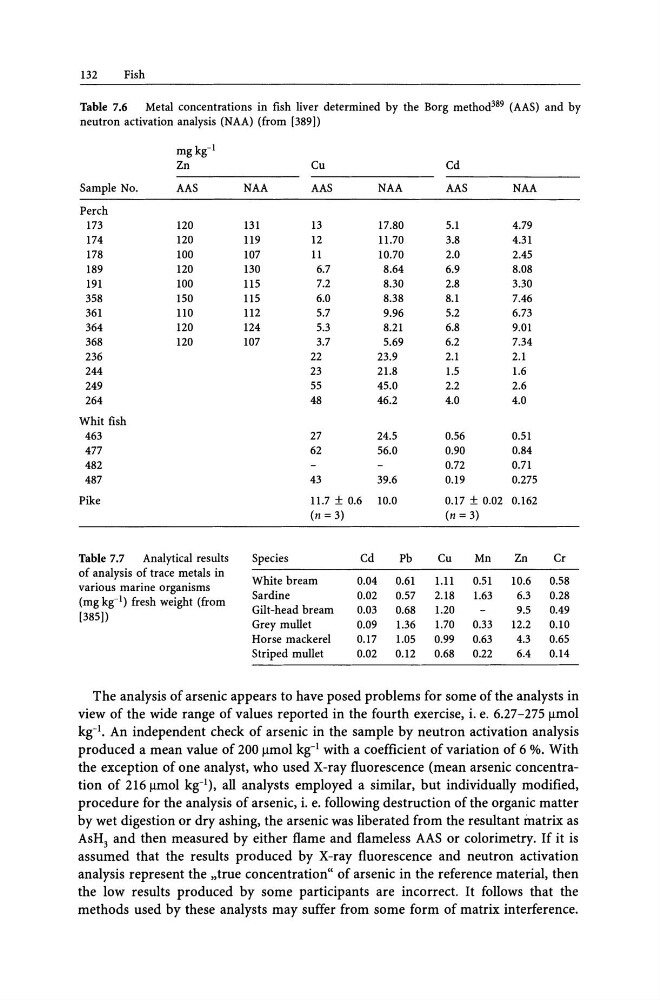
Table 7.6
Metal concentrations in fish liver determined by the Borg method 389 (AAS) and by
neutron activation analysis (NAA) (from [389])
mgkg- I
Zn
Cu
Cd
Sample No.
AAS
NAA
AAS
NAA
AAS
NAA
Perch
173
120
131
13
17.80
5.1
4.79
174
120
119
12
11.70
3.8
4.31
178
100
107
11
10.70
2.0
2.45
189
120
130
6.7
8.64
6.9
8.08
191
100
115
7.2
8.30
2.8
3.30
358
150
115
6.0
8.38
8.1
7.46
361
110
112
5.7
9.96
5.2
6.73
364
120
124
5.3
8.21
6.8
9.01
368
120
107
3.7
5.69
6.2
7.34
236
22
23.9
2.1
2.1
244
23
21.8
1.5
1.6
249
55
45.0
2.2
2.6
264
48
46.2
4.0
4.0
Whit fish
463
27
24.5
0.56
0.51
477
62
56.0
0.90
0.84
482
0.72
0.71
487
43
39.6
0.19
0.275
Pike
11.7 ± 0.6 10.0
0.17 ± 0.02 0.162
(n = 3)
(n = 3)
Table 7.7
Analytical results
Species
Cd
Pb
Cu
Mn
Zn
Cr
of analysis of trace metals in
White bream
0.04
0.61
1.11
0.51
10.6
0.58
various marine organisms
Sardine
0.02
0.57
2.18
1.63
6.3
0.28
(mg kg-I) fresh weight (from
Gilt-head bream
0.03
0.68
1.20
9.5
0.49
[385])
Grey mullet
0.09
1.36
1.70
0.33
12.2
0.10
Horse mackerel
0.17
1.05
0.99
0.63
4.3
0.65
Striped mullet
0.02
0.12
0.68
0.22
6.4
0.14
The analysis of arsenic appears to have posed problems for some of the analysts in
view of the wide range of values reported in the fourth exercise, i. e. 6.27-275Ilffiol
kg-I. An independent check of arsenic in the sample by neutron activation analysis
produced a mean value of 200 Ilffiol kg- I with a coefficient of variation of 6 %. With
the exception of one analyst, who used X-ray fluorescence (mean arsenic concentration of 2161lffiol kg-I), all analysts employed a similar, but individually modified,
procedure for the analysis of arsenic, i. e. following destruction of the organic matter
by wet digestion or dry ashing, the arsenic was liberated from the resultant matrix as
AsH 3 and then measured by either flame and flameless AAS or colorimetry. If it is
assumed that the results produced by X-ray fluorescence and neutron activation
analysis represent the "true concentration" of arsenic in the reference material, then
the low results produced by some participants are incorrect. It follows that the
methods used by these analysts may suffer from some form of matrix interference.
Fish
Table 7.6
Metal concentrations in fish liver determined by the Borg method 389 (AAS) and by
neutron activation analysis (NAA) (from [389])
mgkg- I
Zn
Cu
Cd
Sample No.
AAS
NAA
AAS
NAA
AAS
NAA
Perch
173
120
131
13
17.80
5.1
4.79
174
120
119
12
11.70
3.8
4.31
178
100
107
11
10.70
2.0
2.45
189
120
130
6.7
8.64
6.9
8.08
191
100
115
7.2
8.30
2.8
3.30
358
150
115
6.0
8.38
8.1
7.46
361
110
112
5.7
9.96
5.2
6.73
364
120
124
5.3
8.21
6.8
9.01
368
120
107
3.7
5.69
6.2
7.34
236
22
23.9
2.1
2.1
244
23
21.8
1.5
1.6
249
55
45.0
2.2
2.6
264
48
46.2
4.0
4.0
Whit fish
463
27
24.5
0.56
0.51
477
62
56.0
0.90
0.84
482
0.72
0.71
487
43
39.6
0.19
0.275
Pike
11.7 ± 0.6 10.0
0.17 ± 0.02 0.162
(n = 3)
(n = 3)
Table 7.7
Analytical results
Species
Cd
Pb
Cu
Mn
Zn
Cr
of analysis of trace metals in
White bream
0.04
0.61
1.11
0.51
10.6
0.58
various marine organisms
Sardine
0.02
0.57
2.18
1.63
6.3
0.28
(mg kg-I) fresh weight (from
Gilt-head bream
0.03
0.68
1.20
9.5
0.49
[385])
Grey mullet
0.09
1.36
1.70
0.33
12.2
0.10
Horse mackerel
0.17
1.05
0.99
0.63
4.3
0.65
Striped mullet
0.02
0.12
0.68
0.22
6.4
0.14
The analysis of arsenic appears to have posed problems for some of the analysts in
view of the wide range of values reported in the fourth exercise, i. e. 6.27-275Ilffiol
kg-I. An independent check of arsenic in the sample by neutron activation analysis
produced a mean value of 200 Ilffiol kg- I with a coefficient of variation of 6 %. With
the exception of one analyst, who used X-ray fluorescence (mean arsenic concentration of 2161lffiol kg-I), all analysts employed a similar, but individually modified,
procedure for the analysis of arsenic, i. e. following destruction of the organic matter
by wet digestion or dry ashing, the arsenic was liberated from the resultant matrix as
AsH 3 and then measured by either flame and flameless AAS or colorimetry. If it is
assumed that the results produced by X-ray fluorescence and neutron activation
analysis represent the "true concentration" of arsenic in the reference material, then
the low results produced by some participants are incorrect. It follows that the
methods used by these analysts may suffer from some form of matrix interference.