

82
Water In Ecosystems: A Non Renewable Resource
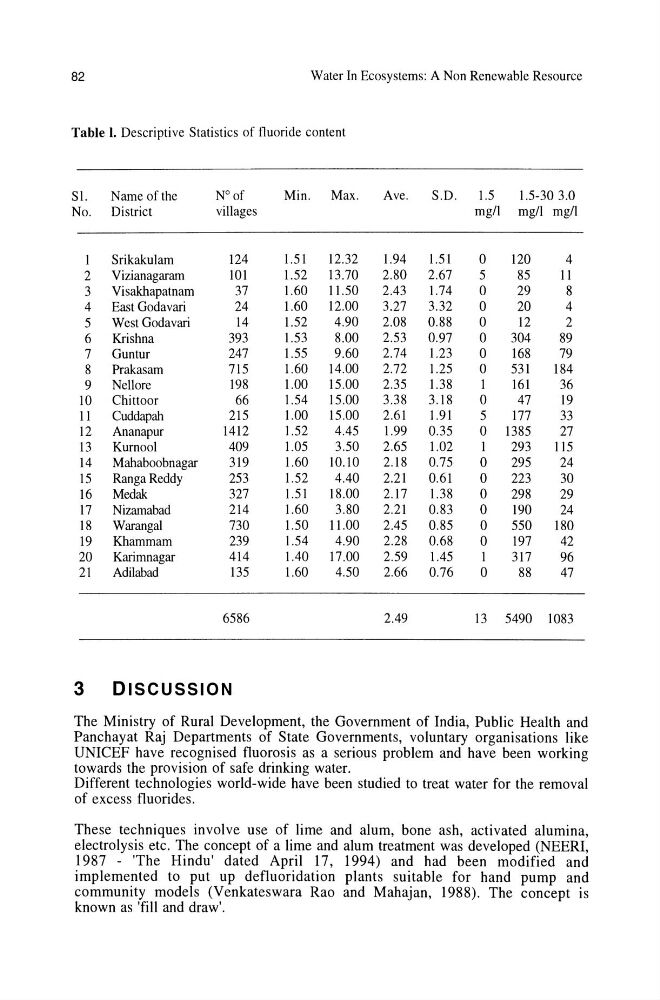
Table I. Descriptive Statistics of fluoride content
Sl.
Name of the
N° of
Min.
Max.
Ave.
S.D.
1.5
1.5-303.0
No. District
villages
mgll mg/l mgll
1
Srikakulam
124
1.51
12.32
1.94
1.51
0
120
4
2
Vizianagaram
101
1.52
l3.70
2.80
2.67
5
85
11
3
Visakbapatnam
37
1.60
11.50
2.43
1.74
0
29
8
4
East Godavari
24
1.60
12.00
3.27
3.32
0
20
4
5
West Godavari
14
1.52
4.90
2.08
0.88
0
12
2
6
Krishna
393
1.53
8.00
2.53
0.97
0
304
89
7
Guntur
247
1.55
9.60
2.74
1.23
0
168
79
8
Prakasam
715
1.60
14.00
2.72
1.25
0
531
184
9
Nellore
198
1.00
15.00
2.35
1.38
1
161
36
10
Chittoor
66
1.54
15.00
3.38
3.18
0
47
19
11
Cuddapah
215
1.00
15.00
2.61
1.91
5
177
33
12
Ananapur
1412
1.52
4.45
1.99
0.35
0 l385
27
l3
Kurnool
409
1.05
3.50
2.65
1.02
1
293
115
14
Mahaboobnagar
319
1.60
10.10
2.18
0.75
0
295
24
15
RangaReddy
253
1.52
4.40
2.21
0.61
0
223
30
16
Medak
327
1.51
18.00
2.17
1.38
0
298
29
17
Nizamabad
214
1.60
3.80
2.21
0.83
0
190
24
18
Warangal
730
1.50
11.00
2.45
0.85
0
550
180
19
Khammam
239
1.54
4.90
2.28
0.68
0
197
42
20
Karimnagar
414
1.40
17.00
2.59
1.45
1
317
96
21
Adilabad
135
1.60
4.50
2.66
0.76
0
88
47
6586
2.49
l3 5490 1083
3 DISCUSSION
The Ministry of Rural Development, the Government of India, Public Health and
Panchayat Raj Departments of State Governments, voluntary organisations like
UNICEF have recognised fluorosis as a serious problem and have been working
towards the provision of safe drinking water.
Different technologies world-wide have been studied to treat water for the removal
of excess fluorides.
These techniques involve use of lime and alum, bone ash, activated alumina,
electrolysis etc. The concept of a lime and alum treatment was developed (NEERI,
1987 - 'The Hindu' dated April 17, 1994) and had been modified and
implemented to put up defluoridation plants suitable for hand pump and
community models (Venkateswara Rao and Mahajan, 1988). The concept is
known as 'fill and draw'.
Water In Ecosystems: A Non Renewable Resource
Table I. Descriptive Statistics of fluoride content
Sl.
Name of the
N° of
Min.
Max.
Ave.
S.D.
1.5
1.5-303.0
No. District
villages
mgll mg/l mgll
1
Srikakulam
124
1.51
12.32
1.94
1.51
0
120
4
2
Vizianagaram
101
1.52
l3.70
2.80
2.67
5
85
11
3
Visakbapatnam
37
1.60
11.50
2.43
1.74
0
29
8
4
East Godavari
24
1.60
12.00
3.27
3.32
0
20
4
5
West Godavari
14
1.52
4.90
2.08
0.88
0
12
2
6
Krishna
393
1.53
8.00
2.53
0.97
0
304
89
7
Guntur
247
1.55
9.60
2.74
1.23
0
168
79
8
Prakasam
715
1.60
14.00
2.72
1.25
0
531
184
9
Nellore
198
1.00
15.00
2.35
1.38
1
161
36
10
Chittoor
66
1.54
15.00
3.38
3.18
0
47
19
11
Cuddapah
215
1.00
15.00
2.61
1.91
5
177
33
12
Ananapur
1412
1.52
4.45
1.99
0.35
0 l385
27
l3
Kurnool
409
1.05
3.50
2.65
1.02
1
293
115
14
Mahaboobnagar
319
1.60
10.10
2.18
0.75
0
295
24
15
RangaReddy
253
1.52
4.40
2.21
0.61
0
223
30
16
Medak
327
1.51
18.00
2.17
1.38
0
298
29
17
Nizamabad
214
1.60
3.80
2.21
0.83
0
190
24
18
Warangal
730
1.50
11.00
2.45
0.85
0
550
180
19
Khammam
239
1.54
4.90
2.28
0.68
0
197
42
20
Karimnagar
414
1.40
17.00
2.59
1.45
1
317
96
21
Adilabad
135
1.60
4.50
2.66
0.76
0
88
47
6586
2.49
l3 5490 1083
3 DISCUSSION
The Ministry of Rural Development, the Government of India, Public Health and
Panchayat Raj Departments of State Governments, voluntary organisations like
UNICEF have recognised fluorosis as a serious problem and have been working
towards the provision of safe drinking water.
Different technologies world-wide have been studied to treat water for the removal
of excess fluorides.
These techniques involve use of lime and alum, bone ash, activated alumina,
electrolysis etc. The concept of a lime and alum treatment was developed (NEERI,
1987 - 'The Hindu' dated April 17, 1994) and had been modified and
implemented to put up defluoridation plants suitable for hand pump and
community models (Venkateswara Rao and Mahajan, 1988). The concept is
known as 'fill and draw'.