

456
IL. Aroyan et al.
I
I
0.2
/
0>....../\/ ....r-JWIfI}
V
-0.2
-0.4
0.4
0.6
0.8
1.2
1.4
1.6
0
0.2
seconds
0.8
! 0.6
:]
gj
l!!
Q.
cD 0.4
-g
:t:=
Q.
E
III
Ql
.~
iii
~
l I
I I
l6
I
14 O' "
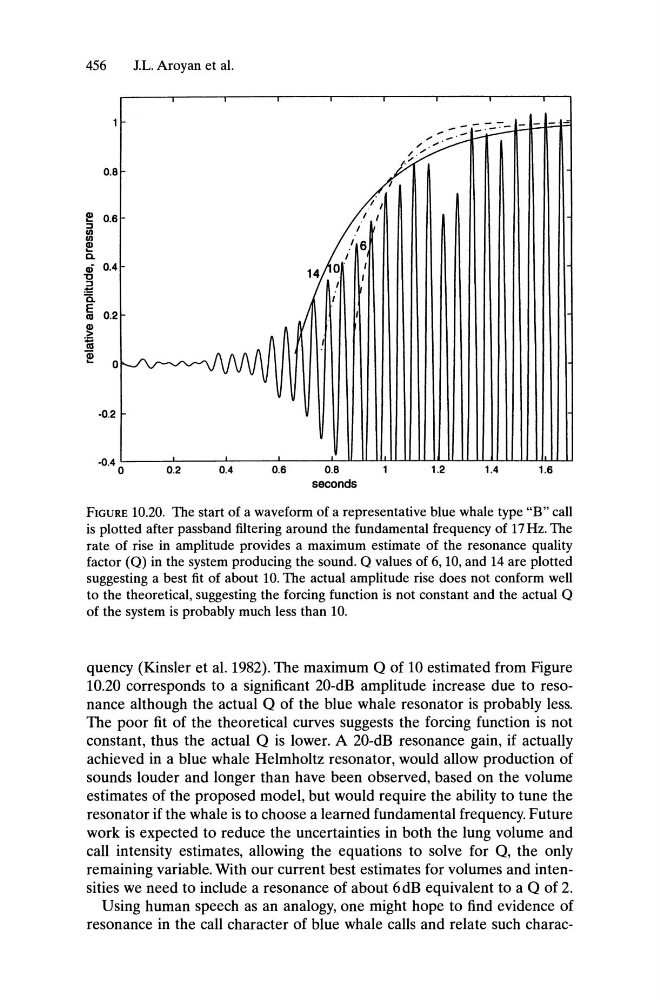
FIGURE 10.20. The start of a waveform of a representative blue whale type "B" call
is plotted after passband filtering around the fundamental frequency of 17 Hz. The
rate of rise in amplitude provides a maximum estimate of the resonance quality
factor (Q) in the system producing the sound. Q values of 6,10, and 14 are plotted
suggesting a best fit of about 10. The actual amplitude rise does not conform well
to the theoretical, suggesting the forcing function is not constant and the actual Q
of the system is probably much less than 10.
quency (Kinsler et al. 1982). The maximum Q of 10 estimated from Figure
10.20 corresponds to a significant 20-dB amplitude increase due to resonance although the actual Q of the blue whale resonator is probably less.
The poor fit of the theoretical curves suggests the forcing function is not
constant, thus the actual Q is lower. A 20-dB resonance gain, if actually
achieved in a blue whale Helmholtz resonator, would allow production of
sounds louder and longer than have been observed, based on the volume
estimates of the proposed model, but would require the ability to tune the
resonator if the whale is to choose a learned fundamental frequency. Future
work is expected to reduce the uncertainties in both the lung volume and
call intensity estimates, allowing the equations to solve for Q, the only
remaining variable. With our current best estimates for volumes and intensities we need to include a resonance of about 6dB equivalent to a Q of 2.
Using human speech as an analogy, one might hope to find evidence of
resonance in the call character of blue whale calls and relate such charac-
IL. Aroyan et al.
I
I
0.2
/
0>....../\/ ....r-JWIfI}
V
-0.2
-0.4
0.4
0.6
0.8
1.2
1.4
1.6
0
0.2
seconds
0.8
! 0.6
:]
gj
l!!
Q.
cD 0.4
-g
:t:=
Q.
E
III
Ql
.~
iii
~
l I
I I
l6
I
14 O' "
FIGURE 10.20. The start of a waveform of a representative blue whale type "B" call
is plotted after passband filtering around the fundamental frequency of 17 Hz. The
rate of rise in amplitude provides a maximum estimate of the resonance quality
factor (Q) in the system producing the sound. Q values of 6,10, and 14 are plotted
suggesting a best fit of about 10. The actual amplitude rise does not conform well
to the theoretical, suggesting the forcing function is not constant and the actual Q
of the system is probably much less than 10.
quency (Kinsler et al. 1982). The maximum Q of 10 estimated from Figure
10.20 corresponds to a significant 20-dB amplitude increase due to resonance although the actual Q of the blue whale resonator is probably less.
The poor fit of the theoretical curves suggests the forcing function is not
constant, thus the actual Q is lower. A 20-dB resonance gain, if actually
achieved in a blue whale Helmholtz resonator, would allow production of
sounds louder and longer than have been observed, based on the volume
estimates of the proposed model, but would require the ability to tune the
resonator if the whale is to choose a learned fundamental frequency. Future
work is expected to reduce the uncertainties in both the lung volume and
call intensity estimates, allowing the equations to solve for Q, the only
remaining variable. With our current best estimates for volumes and intensities we need to include a resonance of about 6dB equivalent to a Q of 2.
Using human speech as an analogy, one might hope to find evidence of
resonance in the call character of blue whale calls and relate such charac-