

10. Acoustic Models of Sound Production
451
1100
~
~ 1000
CI)
Z
III
~ 900
.S
~
'0
III
0800
III
III
!:!
'E Q)
E Q)
~600
'5
Q)
E
:::3
g 500
4QOL----I
--..l.
--'- '
1500
2000
2500
3000
3500
lung volume (liters)
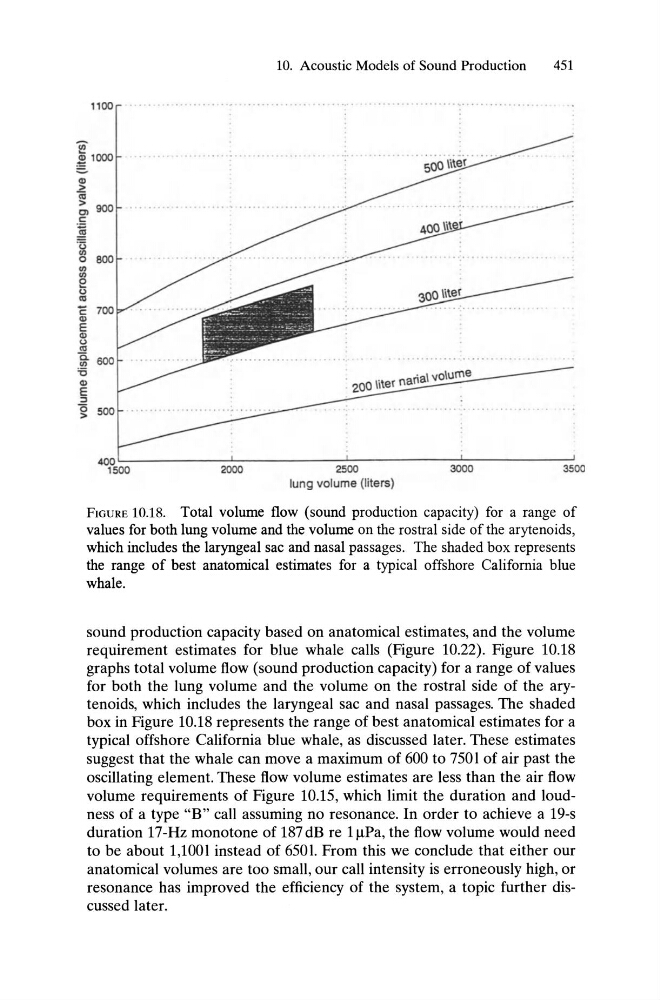
FiGURE 10.18. Total volume flow (sound production capacity) for a range of
values for both lung volume and the volume on the rostral side of the arytenoids,
which includes the laryngeal sac and nasal passages. The shaded box represents
the range of best anatomical estimates for a typical offshore California blue
whale.
sound production capacity based on anatomical estimates, and the volume
requirement estimates for blue whale calls (Figure 10.22). Figure 10.18
graphs total volume flow (sound production capacity) for a range of values
for both the lung volume and the volume on the rostral side of the arytenoids, which includes the laryngeal sac and nasal passages. The shaded
box in Figure 10.18 represents the range of best anatomical estimates for a
typical offshore California blue whale, as discussed later. These estimates
suggest that the whale can move a maximum of 600 to 750 I of air past the
oscillating element. These flow volume estimates are less than the air flow
volume requirements of Figure 10.15, which limit the duration and loudness of a type "B" call assuming no resonance. In order to achieve a 19-s
duration 17-Hz monotone of 187 dB re 11lPa, the flow volume would need
to be about 1,1001 instead of 6501. From this we conclude that either our
anatomical volumes are too small, our call intensity is erroneously high, or
resonance has improved the efficiency of the system, a topic further discussed later.
451
1100
~
~ 1000
CI)
Z
III
~ 900
.S
~
'0
III
0800
III
III
!:!
'E Q)
E Q)
~600
'5
Q)
E
:::3
g 500
4QOL----I
--..l.
--'- '
1500
2000
2500
3000
3500
lung volume (liters)
FiGURE 10.18. Total volume flow (sound production capacity) for a range of
values for both lung volume and the volume on the rostral side of the arytenoids,
which includes the laryngeal sac and nasal passages. The shaded box represents
the range of best anatomical estimates for a typical offshore California blue
whale.
sound production capacity based on anatomical estimates, and the volume
requirement estimates for blue whale calls (Figure 10.22). Figure 10.18
graphs total volume flow (sound production capacity) for a range of values
for both the lung volume and the volume on the rostral side of the arytenoids, which includes the laryngeal sac and nasal passages. The shaded
box in Figure 10.18 represents the range of best anatomical estimates for a
typical offshore California blue whale, as discussed later. These estimates
suggest that the whale can move a maximum of 600 to 750 I of air past the
oscillating element. These flow volume estimates are less than the air flow
volume requirements of Figure 10.15, which limit the duration and loudness of a type "B" call assuming no resonance. In order to achieve a 19-s
duration 17-Hz monotone of 187 dB re 11lPa, the flow volume would need
to be about 1,1001 instead of 6501. From this we conclude that either our
anatomical volumes are too small, our call intensity is erroneously high, or
resonance has improved the efficiency of the system, a topic further discussed later.