

9. Echolocation in Dolphins
385
Target Echo
1 ma
1 ma
1 ma
m0
e. w c
~
... -20
::J
0.
:E
ce
w
~
5
-40
w
a:
0
iOO
200
FREQUENCY (KHZ)
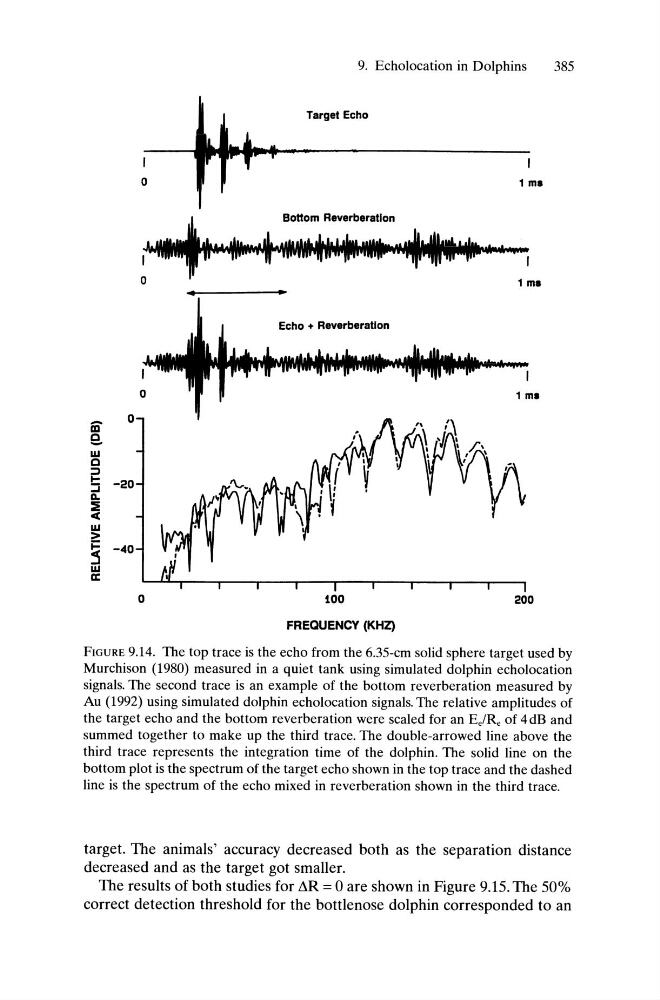
FIGURE 9.14. The top trace is the echo from the 6.35-cm solid sphere target used by
Murchison (1980) measured in a quiet tank using simulated dolphin echolocation
signals. The second trace is an example of the bottom reverberation measured by
Au (1992) using simulated dolphin echolocation signals. The relative amplitudes of
the target echo and the bottom reverberation were scaled for an Ec/R e of 4 dB and
summed together to make up the third trace. The double-arrowed line above the
third trace represents the integration time of the dolphin. The solid line on the
bottom plot is the spectrum of the target echo shown in the top trace and the dashed
line is the spectrum of the echo mixed in reverberation shown in the third trace.
target. The animals' accuracy decreased both as the separation distance
decreased and as the target got smaller.
The results of both studies for ~R = 0 are shown in Figure 9.15. The 50%
correct detection threshold for the bottlenose dolphin corresponded to an
385
Target Echo
1 ma
1 ma
1 ma
m0
e. w c
~
... -20
::J
0.
:E
ce
w
~
5
-40
w
a:
0
iOO
200
FREQUENCY (KHZ)
FIGURE 9.14. The top trace is the echo from the 6.35-cm solid sphere target used by
Murchison (1980) measured in a quiet tank using simulated dolphin echolocation
signals. The second trace is an example of the bottom reverberation measured by
Au (1992) using simulated dolphin echolocation signals. The relative amplitudes of
the target echo and the bottom reverberation were scaled for an Ec/R e of 4 dB and
summed together to make up the third trace. The double-arrowed line above the
third trace represents the integration time of the dolphin. The solid line on the
bottom plot is the spectrum of the target echo shown in the top trace and the dashed
line is the spectrum of the echo mixed in reverberation shown in the third trace.
target. The animals' accuracy decreased both as the separation distance
decreased and as the target got smaller.
The results of both studies for ~R = 0 are shown in Figure 9.15. The 50%
correct detection threshold for the bottlenose dolphin corresponded to an