

9. Echolocation in Dolphins
369
100 r - - - . , - - - - - , - - - - - , - - - - - , - - - . , . - - - - - - ,
N 90
J:
~ 80
>- o 70 1------4-----':...,;
Z
W
:;) 60 1------1T--'--e-~
a
~ 50 t----;":-01"'..
u.
31
40
I~ 30 t---"'-~~r.- T-~o 20 ~f--L..---+------I----------I
.
195
200
205
210
215
PEAK·TQ·PEAK SOURCE LEVEL (DB)
220
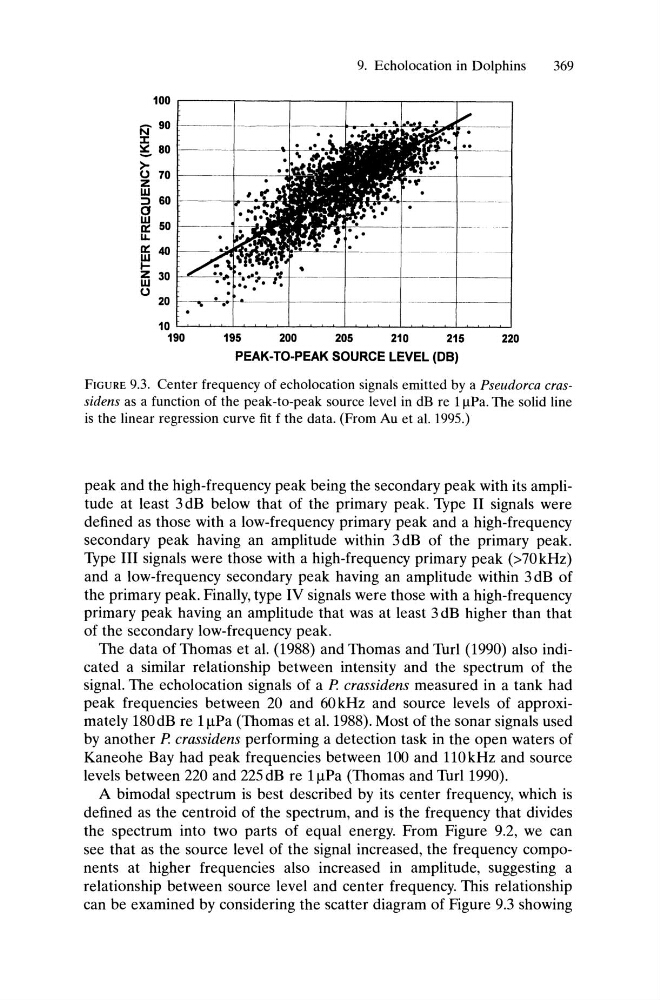
FIGURE 9.3. Center frequency of echolocation signals emitted by a Pseudorca erassidens as a function of the peak-to-peak source level in dB re 1!iPa. The solid line
is the linear regression curve fit f the data. (From Au et al. 1995.)
peak and the high-frequency peak being the secondary peak with its amplitude at least 3 dB below that of the primary peak. Type II signals were
defined as those with a low-frequency primary peak and a high-frequency
secondary peak having an amplitude within 3 dB of the primary peak.
Type III signals were those with a high-frequency primary peak (>70 kHz)
and a low-frequency secondary peak having an amplitude within 3 dB of
the primary peak. Finally, type IV signals were those with a high-frequency
primary peak having an amplitude that was at least 3 dB higher than that
of the secondary low-frequency peak.
The data of Thomas et al. (1988) and Thomas and Turl (1990) also indicated a similar relationship between intensity and the spectrum of the
signal. The echolocation signals of a P crassidens measured in a tank had
peak frequencies between 20 and 60 kHz and source levels of approximately 180dB re 1f..lPa (Thomas et al. 1988). Most of the sonar signals used
by another P crassidens performing a detection task in the open waters of
Kaneohe Bay had peak frequencies between 100 and 110kHz and source
levels between 220 and 225 dB re 1f..lPa (Thomas and Turl 1990).
A bimodal spectrum is best described by its center frequency, which is
defined as the centroid of the spectrum, and is the frequency that divides
the spectrum into two parts of equal energy. From Figure 9.2, we can
see that as the source level of the signal increased, the frequency components at higher frequencies also increased in amplitude, suggesting a
relationship between source level and center frequency. This relationship
can be examined by considering the scatter diagram of Figure 9.3 showing
369
100 r - - - . , - - - - - , - - - - - , - - - - - , - - - . , . - - - - - - ,
N 90
J:
~ 80
>- o 70 1------4-----':...,;
Z
W
:;) 60 1------1T--'--e-~
a
~ 50 t----;":-01"'..
u.
31
40
I~ 30 t---"'-~~r.- T-~o 20 ~f--L..---+------I----------I
.
195
200
205
210
215
PEAK·TQ·PEAK SOURCE LEVEL (DB)
220
FIGURE 9.3. Center frequency of echolocation signals emitted by a Pseudorca erassidens as a function of the peak-to-peak source level in dB re 1!iPa. The solid line
is the linear regression curve fit f the data. (From Au et al. 1995.)
peak and the high-frequency peak being the secondary peak with its amplitude at least 3 dB below that of the primary peak. Type II signals were
defined as those with a low-frequency primary peak and a high-frequency
secondary peak having an amplitude within 3 dB of the primary peak.
Type III signals were those with a high-frequency primary peak (>70 kHz)
and a low-frequency secondary peak having an amplitude within 3 dB of
the primary peak. Finally, type IV signals were those with a high-frequency
primary peak having an amplitude that was at least 3 dB higher than that
of the secondary low-frequency peak.
The data of Thomas et al. (1988) and Thomas and Turl (1990) also indicated a similar relationship between intensity and the spectrum of the
signal. The echolocation signals of a P crassidens measured in a tank had
peak frequencies between 20 and 60 kHz and source levels of approximately 180dB re 1f..lPa (Thomas et al. 1988). Most of the sonar signals used
by another P crassidens performing a detection task in the open waters of
Kaneohe Bay had peak frequencies between 100 and 110kHz and source
levels between 220 and 225 dB re 1f..lPa (Thomas and Turl 1990).
A bimodal spectrum is best described by its center frequency, which is
defined as the centroid of the spectrum, and is the frequency that divides
the spectrum into two parts of equal energy. From Figure 9.2, we can
see that as the source level of the signal increased, the frequency components at higher frequencies also increased in amplitude, suggesting a
relationship between source level and center frequency. This relationship
can be examined by considering the scatter diagram of Figure 9.3 showing