

9. Echolocation in Dolphins
367
Kaneohe Bay
SL =210 - 227 dB re 1 II Pa
I
250115
Tank
SL =170 - 185 dB re 1 IIPa
1.0
S
:2. 0.5
100
FREQUENCY (KHZ)
200
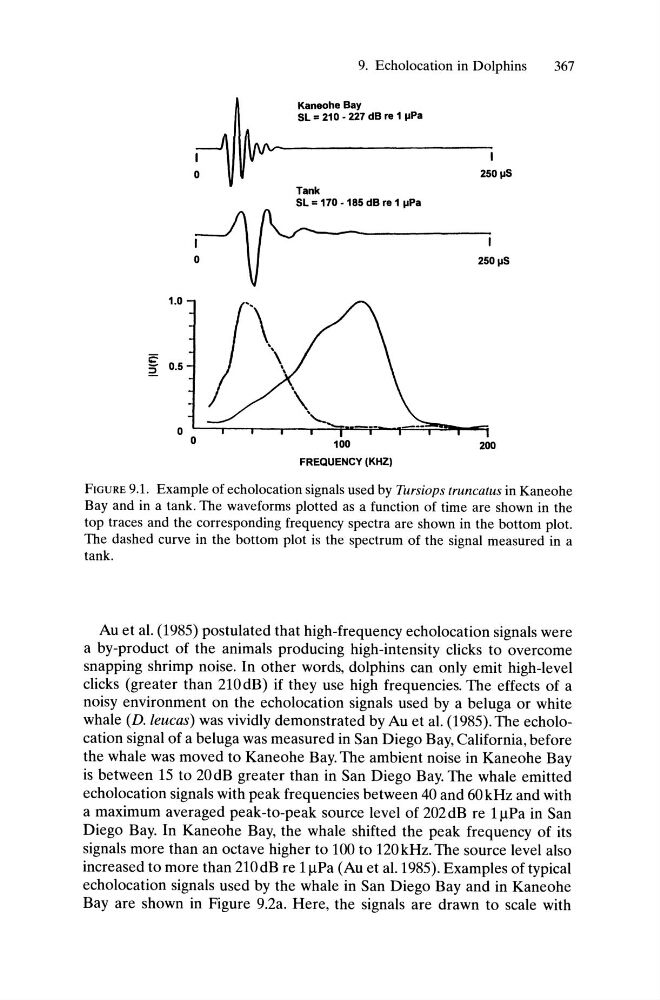
FIGURE 9.1. Example of echolocation signals used by Tursiops truncatus in Kaneohe
Bay and in a tank. The waveforms plotted as a function of time are shown in the
top traces and the corresponding frequency spectra are shown in the bottom plot.
The dashed curve in the bottom plot is the spectrum of the signal measured in a
tank.
Au et al. (1985) postulated that high-frequency echolocation signals were
a by-product of the animals producing high-intensity clicks to overcome
snapping shrimp noise. In other words, dolphins can only emit high-level
clicks (greater than 210dB) if they use high frequencies. The effects of a
noisy environment on the echolocation signals used by a beluga or white
whale (D. leucas) was vividly demonstrated by Au et al. (1985). The echolocation signal of a beluga was measured in San Diego Bay, California, before
the whale was moved to Kaneohe Bay. The ambient noise in Kaneohe Bay
is between 15 to 20dB greater than in San Diego Bay. The whale emitted
echolocation signals with peak frequencies between 40 and 60 kHz and with
a maximum averaged peak-to-peak source level of 202 dB re 11lPa in San
Diego Bay. In Kaneohe Bay, the whale shifted the peak frequency of its
signals more than an octave higher to 100 to 120kHz. The source level also
increased to more than 210 dB re 11lPa (Au et at. 1985). Examples of typical
echolocation signals used by the whale in San Diego Bay and in Kaneohe
Bay are shown in Figure 9.2a. Here, the signals are drawn to scale with
367
Kaneohe Bay
SL =210 - 227 dB re 1 II Pa
I
250115
Tank
SL =170 - 185 dB re 1 IIPa
1.0
S
:2. 0.5
100
FREQUENCY (KHZ)
200
FIGURE 9.1. Example of echolocation signals used by Tursiops truncatus in Kaneohe
Bay and in a tank. The waveforms plotted as a function of time are shown in the
top traces and the corresponding frequency spectra are shown in the bottom plot.
The dashed curve in the bottom plot is the spectrum of the signal measured in a
tank.
Au et al. (1985) postulated that high-frequency echolocation signals were
a by-product of the animals producing high-intensity clicks to overcome
snapping shrimp noise. In other words, dolphins can only emit high-level
clicks (greater than 210dB) if they use high frequencies. The effects of a
noisy environment on the echolocation signals used by a beluga or white
whale (D. leucas) was vividly demonstrated by Au et al. (1985). The echolocation signal of a beluga was measured in San Diego Bay, California, before
the whale was moved to Kaneohe Bay. The ambient noise in Kaneohe Bay
is between 15 to 20dB greater than in San Diego Bay. The whale emitted
echolocation signals with peak frequencies between 40 and 60 kHz and with
a maximum averaged peak-to-peak source level of 202 dB re 11lPa in San
Diego Bay. In Kaneohe Bay, the whale shifted the peak frequency of its
signals more than an octave higher to 100 to 120kHz. The source level also
increased to more than 210 dB re 11lPa (Au et at. 1985). Examples of typical
echolocation signals used by the whale in San Diego Bay and in Kaneohe
Bay are shown in Figure 9.2a. Here, the signals are drawn to scale with