

316
W.E Dolphin
tion [a multistate Holzman distribution as used in Dolphin et al. (1994)] of
the form:
A
(l +e - (x - xo)/sxo )(1 +e-(x-xil/sxl )
This "soft" rectified version of the stimulus signal was then Fourier transformed. The averaged scalp-recorded response was cross-correlated with
the envelope of the corresponding multienvelope stimulus. Peaks in the
resulting cross-correlation function (CCF) were used as an estimate of
response latency after first subtracting the acoustic delay of the system (i.e.,
time for the acoustic signal to travel from the projector to the dolphin's
pan bone).
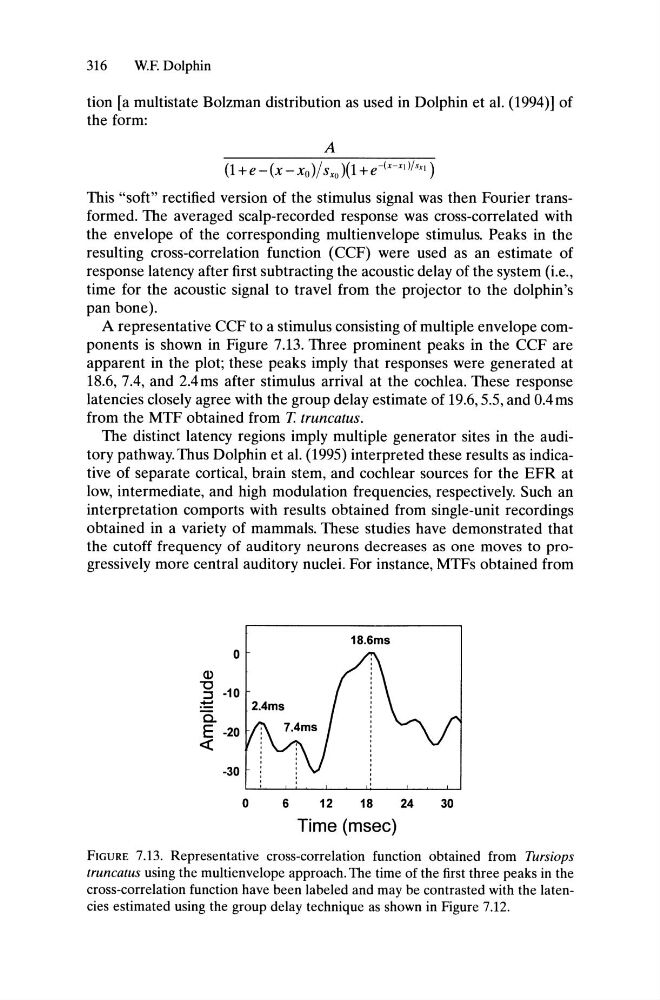
A representative CCF to a stimulus consisting of multiple envelope components is shown in Figure 7.13. Three prominent peaks in the CCF are
apparent in the plot; these peaks imply that responses were generated at
18.6, 7.4, and 2.4ms after stimulus arrival at the cochlea. These response
latencies closely agree with the group delay estimate of 19.6,5.5, and 0.4 ms
from the MTF obtained from T. truncatus.
The distinct latency regions imply multiple generator sites in the auditory pathway. Thus Dolphin et al. (1995) interpreted these results as indicative of separate cortical, brain stem, and cochlear sources for the EFR at
low, intermediate, and high modulation frequencies, respectively. Such an
interpretation comports with results obtained from single-unit recordings
obtained in a variety of mammals. These studies have demonstrated that
the cutoff frequency of auditory neurons decreases as one moves to progressively more central auditory nuclei. For instance, MTFs obtained from
18.6ms
0
Q)
"'0 -10
:::J
~
C.
E -20
«
-30
0
6
12
18
24
30
Time (msec)
FIGURE 7.13. Representative cross-correlation function obtained from Tursiops
truncatus using the multienvelope approach. The time of the first three peaks in the
cross-correlation function have been labeled and may be contrasted with the latencies estimated using the group delay technique as shown in Figure 7.12.
W.E Dolphin
tion [a multistate Holzman distribution as used in Dolphin et al. (1994)] of
the form:
A
(l +e - (x - xo)/sxo )(1 +e-(x-xil/sxl )
This "soft" rectified version of the stimulus signal was then Fourier transformed. The averaged scalp-recorded response was cross-correlated with
the envelope of the corresponding multienvelope stimulus. Peaks in the
resulting cross-correlation function (CCF) were used as an estimate of
response latency after first subtracting the acoustic delay of the system (i.e.,
time for the acoustic signal to travel from the projector to the dolphin's
pan bone).
A representative CCF to a stimulus consisting of multiple envelope components is shown in Figure 7.13. Three prominent peaks in the CCF are
apparent in the plot; these peaks imply that responses were generated at
18.6, 7.4, and 2.4ms after stimulus arrival at the cochlea. These response
latencies closely agree with the group delay estimate of 19.6,5.5, and 0.4 ms
from the MTF obtained from T. truncatus.
The distinct latency regions imply multiple generator sites in the auditory pathway. Thus Dolphin et al. (1995) interpreted these results as indicative of separate cortical, brain stem, and cochlear sources for the EFR at
low, intermediate, and high modulation frequencies, respectively. Such an
interpretation comports with results obtained from single-unit recordings
obtained in a variety of mammals. These studies have demonstrated that
the cutoff frequency of auditory neurons decreases as one moves to progressively more central auditory nuclei. For instance, MTFs obtained from
18.6ms
0
Q)
"'0 -10
:::J
~
C.
E -20
«
-30
0
6
12
18
24
30
Time (msec)
FIGURE 7.13. Representative cross-correlation function obtained from Tursiops
truncatus using the multienvelope approach. The time of the first three peaks in the
cross-correlation function have been labeled and may be contrasted with the latencies estimated using the group delay technique as shown in Figure 7.12.