

314
W.E Dolphin
100 a.
2 Tones
80
60
40
--- > 20
C
0
-- (1) 0 50 100 150 200 250 300
"'0
100
::l
b.
3 Tones
~
80
c
0>
60
ttl
~
40
(1)
20
en
c
0
0
00 50 100 150 200 250 300
en
(1)
100
4 Tones
0:::
c.
80
60
40
20
0
0 50 100 150 200 250 300
Frequency (Hz)
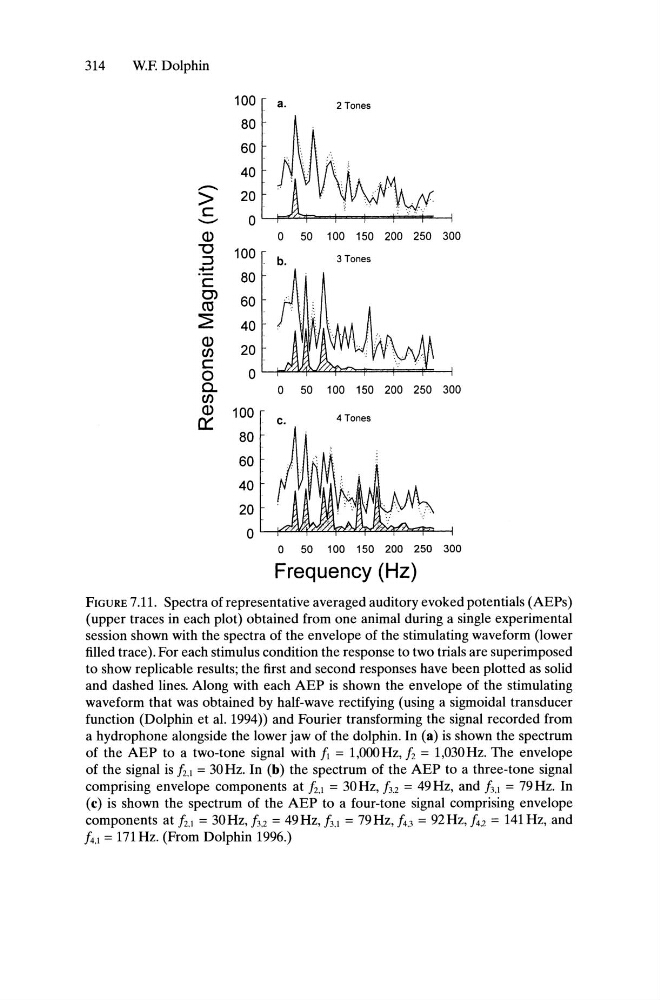
FIGURE 7.11. Spectra of representative averaged auditory evoked potentials (AEPs)
(upper traces in each plot) obtained from one animal during a single experimental
session shown with the spectra of the envelope of the stimulating waveform (lower
filled trace). For each stimulus condition the response to two trials are superimposed
to show replicable results; the first and second responses have been plotted as solid
and dashed lines. Along with each AEP is shown the envelope of the stimulating
waveform that was obtained by half-wave rectifying (using a sigmoidal transducer
function (Dolphin et al. 1994» and Fourier transforming the signal recorded from
a hydrophone alongside the lower jaw of the dolphin. In (a) is shown the spectrum
of the AEP to a two-tone signal with II = 1,000 Hz, 12 = 1,030Hz. The envelope
of the signal is f2,1 = 30Hz. In (b) the spectrum of the AEP to a three-tone signal
comprising envelope components at f2,1 = 30Hz, A2 = 49Hz, and f3.1 = 79Hz. In
(c) is shown the spectrum of the AEP to a four-tone signal comprising envelope
components at f2,1 = 30Hz, A2 = 49Hz, AI = 79Hz, f4.3 = 92Hz, /4,2 = 141 Hz, and
f4,1 =171Hz. (From Dolphin 1996.)
W.E Dolphin
100 a.
2 Tones
80
60
40
--- > 20
C
0
-- (1) 0 50 100 150 200 250 300
"'0
100
::l
b.
3 Tones
~
80
c
0>
60
ttl
~
40
(1)
20
en
c
0
0
00 50 100 150 200 250 300
en
(1)
100
4 Tones
0:::
c.
80
60
40
20
0
0 50 100 150 200 250 300
Frequency (Hz)
FIGURE 7.11. Spectra of representative averaged auditory evoked potentials (AEPs)
(upper traces in each plot) obtained from one animal during a single experimental
session shown with the spectra of the envelope of the stimulating waveform (lower
filled trace). For each stimulus condition the response to two trials are superimposed
to show replicable results; the first and second responses have been plotted as solid
and dashed lines. Along with each AEP is shown the envelope of the stimulating
waveform that was obtained by half-wave rectifying (using a sigmoidal transducer
function (Dolphin et al. 1994» and Fourier transforming the signal recorded from
a hydrophone alongside the lower jaw of the dolphin. In (a) is shown the spectrum
of the AEP to a two-tone signal with II = 1,000 Hz, 12 = 1,030Hz. The envelope
of the signal is f2,1 = 30Hz. In (b) the spectrum of the AEP to a three-tone signal
comprising envelope components at f2,1 = 30Hz, A2 = 49Hz, and f3.1 = 79Hz. In
(c) is shown the spectrum of the AEP to a four-tone signal comprising envelope
components at f2,1 = 30Hz, A2 = 49Hz, AI = 79Hz, f4.3 = 92Hz, /4,2 = 141 Hz, and
f4,1 =171Hz. (From Dolphin 1996.)