

7. Electrophysiological Techniques
303
~ 12.0
10.0
"0
~ 8.0
C.
E 6.0
co 4.0
Click
a.
-..-. Noise
I
2.0
-"'=
CO
0.0
a..
~
"
100
1W
1~
1~
1~
1W
Intensity (dB SPL)
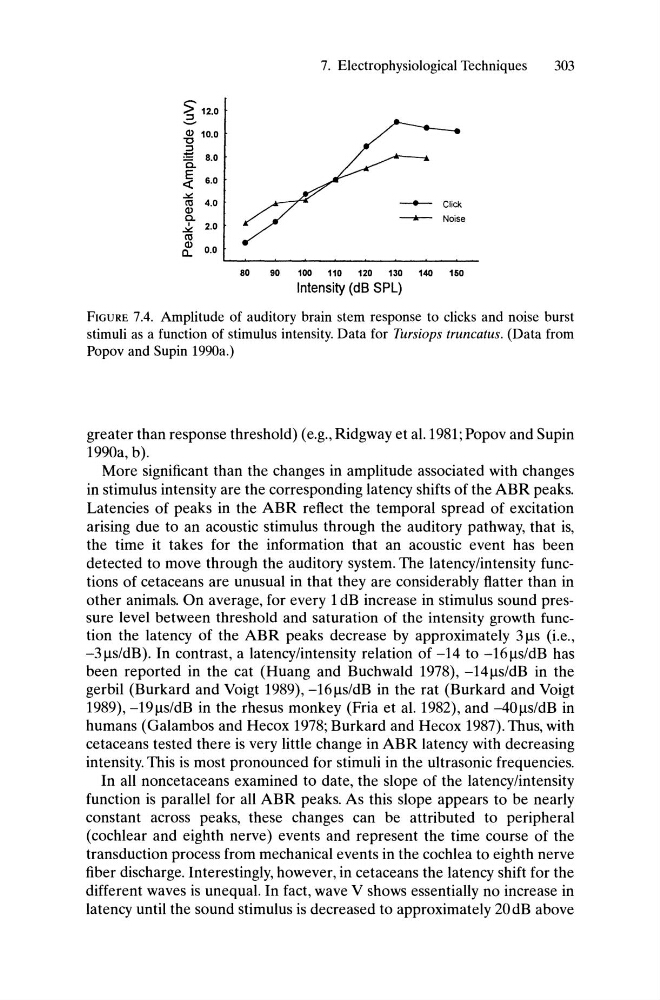
FIGURE 7.4. Amplitude of auditory brain stem response to clicks and noise burst
stimuli as a function of stimulus intensity. Data for Tursiops truncatus. (Data from
Popov and Supin 1990a.)
greater than response threshold) (e.g., Ridgway et a1.1981; Popov and Supin
1990a, b).
More significant than the changes in amplitude associated with changes
in stimulus intensity are the corresponding latency shifts of the ABR peaks.
Latencies of peaks in the ABR reflect the temporal spread of excitation
arising due to an acoustic stimulus through the auditory pathway, that is,
the time it takes for the information that an acoustic event has been
detected to move through the auditory system. The latency/intensity functions of cetaceans are unusual in that they are considerably flatter than in
other animals. On average, for every 1dB increase in stimulus sound pressure level between threshold and saturation of the intensity growth function the latency of the ABR peaks decrease by approximately 31.l.s (i.e.,
-3I.l.s/dB). In contrast, a latency/intensity relation of -14 to -16I.l.s/dB has
been reported in the cat (Huang and Buchwald 1978), -14I.l.s/dB in the
gerbil (Burkard and Voigt 1989), -16I.l.s/dB in the rat (Burkard and Voigt
1989), -19I.l.s/dB in the rhesus monkey (Fria et al. 1982), and -40I.l.s/dB in
humans (Galambos and Hecox 1978; Burkard and Hecox 1987). Thus, with
cetaceans tested there is very little change in ABR latency with decreasing
intensity. This is most pronounced for stimuli in the ultrasonic frequencies.
In all noncetaceans examined to date, the slope of the latency/intensity
function is parallel for all ABR peaks. As this slope appears to be nearly
constant across peaks, these changes can be attributed to peripheral
(cochlear and eighth nerve) events and represent the time course of the
transduction process from mechanical events in the cochlea to eighth nerve
fiber discharge. Interestingly, however, in cetaceans the latency shift for the
different waves is unequal. In fact, wave V shows essentially no increase in
latency until the sound stimulus is decreased to approximately 20dB above
303
~ 12.0
10.0
"0
~ 8.0
C.
E 6.0
co 4.0
Click
a.
-..-. Noise
I
2.0
-"'=
CO
0.0
a..
~
"
100
1W
1~
1~
1~
1W
Intensity (dB SPL)
FIGURE 7.4. Amplitude of auditory brain stem response to clicks and noise burst
stimuli as a function of stimulus intensity. Data for Tursiops truncatus. (Data from
Popov and Supin 1990a.)
greater than response threshold) (e.g., Ridgway et a1.1981; Popov and Supin
1990a, b).
More significant than the changes in amplitude associated with changes
in stimulus intensity are the corresponding latency shifts of the ABR peaks.
Latencies of peaks in the ABR reflect the temporal spread of excitation
arising due to an acoustic stimulus through the auditory pathway, that is,
the time it takes for the information that an acoustic event has been
detected to move through the auditory system. The latency/intensity functions of cetaceans are unusual in that they are considerably flatter than in
other animals. On average, for every 1dB increase in stimulus sound pressure level between threshold and saturation of the intensity growth function the latency of the ABR peaks decrease by approximately 31.l.s (i.e.,
-3I.l.s/dB). In contrast, a latency/intensity relation of -14 to -16I.l.s/dB has
been reported in the cat (Huang and Buchwald 1978), -14I.l.s/dB in the
gerbil (Burkard and Voigt 1989), -16I.l.s/dB in the rat (Burkard and Voigt
1989), -19I.l.s/dB in the rhesus monkey (Fria et al. 1982), and -40I.l.s/dB in
humans (Galambos and Hecox 1978; Burkard and Hecox 1987). Thus, with
cetaceans tested there is very little change in ABR latency with decreasing
intensity. This is most pronounced for stimuli in the ultrasonic frequencies.
In all noncetaceans examined to date, the slope of the latency/intensity
function is parallel for all ABR peaks. As this slope appears to be nearly
constant across peaks, these changes can be attributed to peripheral
(cochlear and eighth nerve) events and represent the time course of the
transduction process from mechanical events in the cochlea to eighth nerve
fiber discharge. Interestingly, however, in cetaceans the latency shift for the
different waves is unequal. In fact, wave V shows essentially no increase in
latency until the sound stimulus is decreased to approximately 20dB above