

1. Overview
15
P,
Po
R
s
Po'·
P,
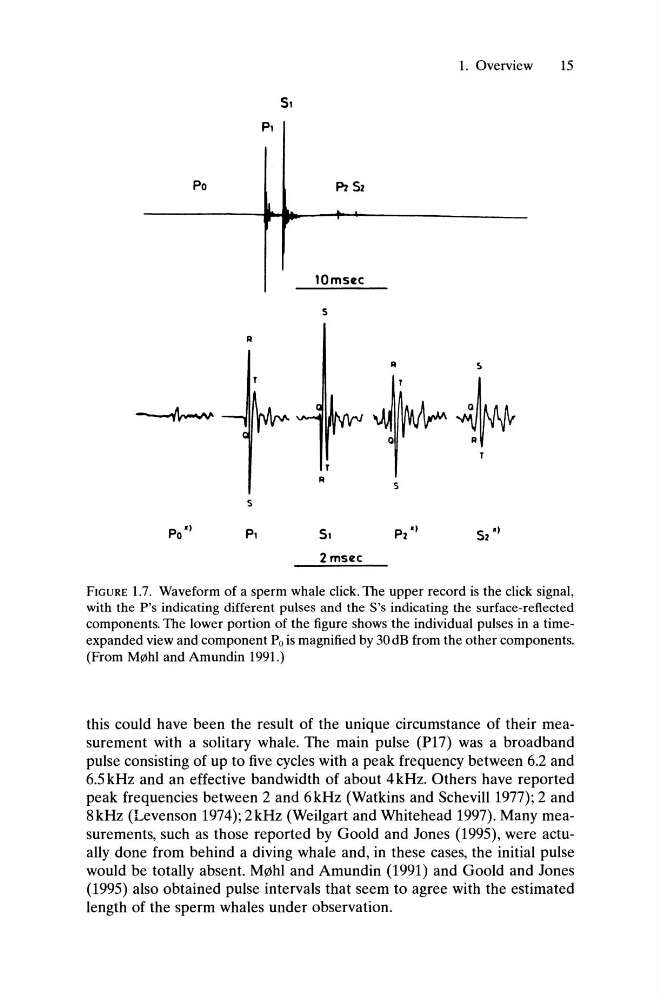
FIGURE 1.7. Waveform of a sperm whale click. The upper record is the click signal,
with the P's indicating different pulses and the S's indicating the surface-reflected
components. The lower portion of the figure shows the individual pulses in a timeexpanded view and component Po is magnified by 30 dB from the other components.
(From M!1Ihl and Amundin 1991.)
this could have been the result of the unique circumstance of their measurement with a solitary whale. The main pulse (PI7) was a broadband
pulse consisting of up to five cycles with a peak frequency between 6.2 and
6.5 kHz and an effective bandwidth of about 4 kHz. Others have reported
peak frequencies between 2 and 6kHz (Watkins and Schevill 1977); 2 and
8kHz (Levenson 1974); 2kHz (Weilgart and Whitehead 1997). Many measurements, such as those reported by Goold and Jones (1995), were actually done from behind a diving whale and, in these cases, the initial pulse
would be totally absent. M0hl and Amundin (1991) and Goold and Jones
(1995) also obtained pulse intervals that seem to agree with the estimated
length of the sperm whales under observation.
15
P,
Po
R
s
Po'·
P,
FIGURE 1.7. Waveform of a sperm whale click. The upper record is the click signal,
with the P's indicating different pulses and the S's indicating the surface-reflected
components. The lower portion of the figure shows the individual pulses in a timeexpanded view and component Po is magnified by 30 dB from the other components.
(From M!1Ihl and Amundin 1991.)
this could have been the result of the unique circumstance of their measurement with a solitary whale. The main pulse (PI7) was a broadband
pulse consisting of up to five cycles with a peak frequency between 6.2 and
6.5 kHz and an effective bandwidth of about 4 kHz. Others have reported
peak frequencies between 2 and 6kHz (Watkins and Schevill 1977); 2 and
8kHz (Levenson 1974); 2kHz (Weilgart and Whitehead 1997). Many measurements, such as those reported by Goold and Jones (1995), were actually done from behind a diving whale and, in these cases, the initial pulse
would be totally absent. M0hl and Amundin (1991) and Goold and Jones
(1995) also obtained pulse intervals that seem to agree with the estimated
length of the sperm whales under observation.