

400
hearing loss will most likely differ depending upon the species and its type of hearing, as well as the ratio of pressure and particle motion of the sound source.
Aspects of sound detection other than threshold sensitivity can be affected by
noise exposure. For example, Wysocki and Ladich ( 2005 ) exposed goldfi sh to 158
dB re 1 μPa white noise for 24 h and found that this increased the minimum click
period that could be resolved. As the ability to resolve temporal patterns is an important aspect of sound perception, defi cits in temporal resolution ability could negatively impact fi sh. Background noise could also mask biologically relevant auditory
or vibratory signals without necessarily damaging the auditory or lateral line system
(Fay and Megela Simmons 1999 ). Although auditory masking is an important issue
in understanding the effects of sound on fi shes, as sensory hair cells are likely not
damaged by background noise, this topic is out of the purview of this review.
Also, many anthropogenic sound sources, such as sonars, seismic air guns, and
pile driving, are very different from most continuous laboratory sound sources, e.g.,
1 2 3 4 5 6 7
0
20
40
60
80
100
1 2 3 4 5 6 7
0
20
40
60
80
100
1 2 3 4 5 6 7
0
20
40
60
80
100
1 2 3 4 5 6 7
0
20
40
60
80
100
Rostral-caudal axis
a
b
c
d
Mean (± S.E.) percent hair cell bundle loss
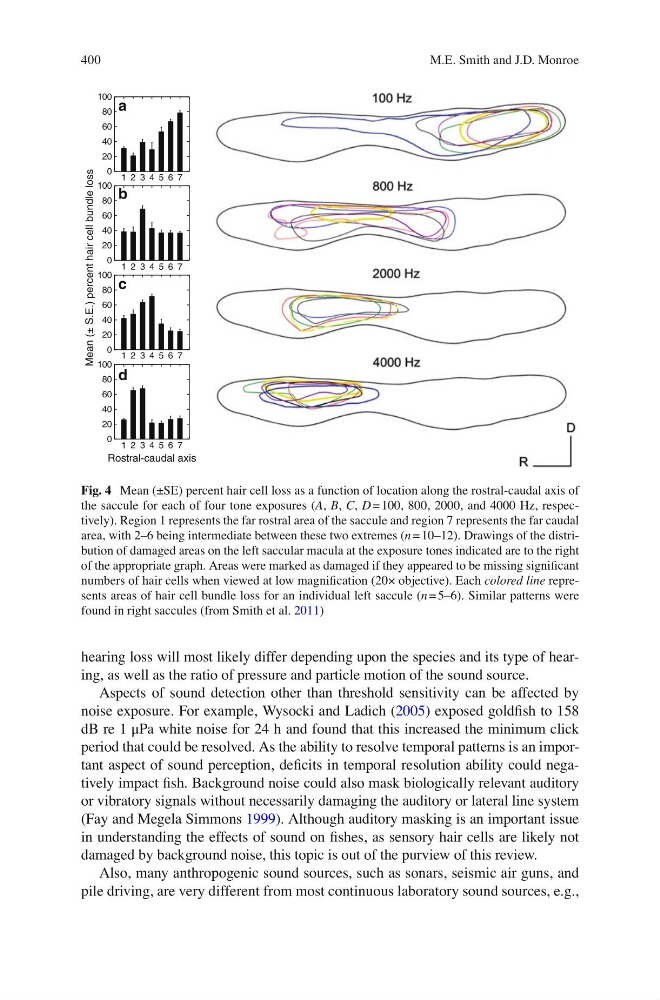
Fig. 4 Mean (±SE) percent hair cell loss as a function of location along the rostral-caudal axis of
the saccule for each of four tone exposures ( A , B , C , D = 100, 800, 2000, and 4000 Hz, respectively). Region 1 represents the far rostral area of the saccule and region 7 represents the far caudal
area, with 2–6 being intermediate between these two extremes ( n = 10–12). Drawings of the distribution of damaged areas on the left saccular macula at the exposure tones indicated are to the right
of the appropriate graph. Areas were marked as damaged if they appeared to be missing signifi cant
numbers of hair cells when viewed at low magnifi cation (20× objective). Each colored line represents areas of hair cell bundle loss for an individual left saccule ( n = 5–6). Similar patterns were
found in right saccules (from Smith et al. 2011 )
M.E. Smith and J.D. Monroe
hearing loss will most likely differ depending upon the species and its type of hearing, as well as the ratio of pressure and particle motion of the sound source.
Aspects of sound detection other than threshold sensitivity can be affected by
noise exposure. For example, Wysocki and Ladich ( 2005 ) exposed goldfi sh to 158
dB re 1 μPa white noise for 24 h and found that this increased the minimum click
period that could be resolved. As the ability to resolve temporal patterns is an important aspect of sound perception, defi cits in temporal resolution ability could negatively impact fi sh. Background noise could also mask biologically relevant auditory
or vibratory signals without necessarily damaging the auditory or lateral line system
(Fay and Megela Simmons 1999 ). Although auditory masking is an important issue
in understanding the effects of sound on fi shes, as sensory hair cells are likely not
damaged by background noise, this topic is out of the purview of this review.
Also, many anthropogenic sound sources, such as sonars, seismic air guns, and
pile driving, are very different from most continuous laboratory sound sources, e.g.,
1 2 3 4 5 6 7
0
20
40
60
80
100
1 2 3 4 5 6 7
0
20
40
60
80
100
1 2 3 4 5 6 7
0
20
40
60
80
100
1 2 3 4 5 6 7
0
20
40
60
80
100
Rostral-caudal axis
a
b
c
d
Mean (± S.E.) percent hair cell bundle loss
Fig. 4 Mean (±SE) percent hair cell loss as a function of location along the rostral-caudal axis of
the saccule for each of four tone exposures ( A , B , C , D = 100, 800, 2000, and 4000 Hz, respectively). Region 1 represents the far rostral area of the saccule and region 7 represents the far caudal
area, with 2–6 being intermediate between these two extremes ( n = 10–12). Drawings of the distribution of damaged areas on the left saccular macula at the exposure tones indicated are to the right
of the appropriate graph. Areas were marked as damaged if they appeared to be missing signifi cant
numbers of hair cells when viewed at low magnifi cation (20× objective). Each colored line represents areas of hair cell bundle loss for an individual left saccule ( n = 5–6). Similar patterns were
found in right saccules (from Smith et al. 2011 )
M.E. Smith and J.D. Monroe