

399
is concomitant with hair cell regeneration (Smith et al. 2006 , 2011 ; Smith 2016 ).
Lastly, the teleost saccule is at least crudely tonotopically organized such that
intense low and high frequency sounds produce sensory hair cell loss in the caudal
and rostral regions, respectively (Fig. 4 ; Enger 1981 ; Smith et al. 2011 ). Thus, fi sh
exposed to lower frequency tones exhibit greater TTS at lower frequencies, while
high-tone exposure leads to hearing loss at higher frequencies (Smith et al. 2011 ).
There are some caveats to these generalizations. First, all fi sh hearing loss studies
have reported TTS as dB relative to SPL for control animals, and sound stimuli were
quantifi ed in terms of SPL (dB re 1 μPa). However, not all fi sh can detect sound as
pressure stimuli and fi sh can also detect sound stimuli in the form of particle displacement. There is a continuum of hearing in fi shes, with fi shes that have a high
sensitivity to pressure on one end of the spectrum, and those that detect only particle
motion on the other (Popper and Fay 2011 ). Fishes that detect the pressure component of sound do so because of anatomical specializations which couple gas- fi lled
structures such as swim bladders, suprabranchial chambers, and otic bullae (which
are compressible in response to pressure fl uctuations) to the fl uid-fi lled canals of the
inner ear. Species with these specializations, e.g., goldfi sh, fathead minnows, lake
chub, koi, have lower hearing thresholds and are more susceptible to sound-induced
hearing loss than species lacking such specializations that only detect the particle
motion component of sound, e.g., bluegill sunfi sh, tilapia, rainbow trout. Although
particle motion thresholds are now being quantifi ed (Radford et al. 2014 ), particle
motion threshold shifts have not yet been measured. Thus, the general patterns of
0
20
40
60
80
100
120
-5
0
5
10
15
20
25
30
0
20
40
60
80
100
120
SPD above baseline threshold (dB)
-5
0
5
10
15
20
25
30
TTS(dB)
Tilapia
Goldfish
Minnow
Catfish
Bluegill sunfish
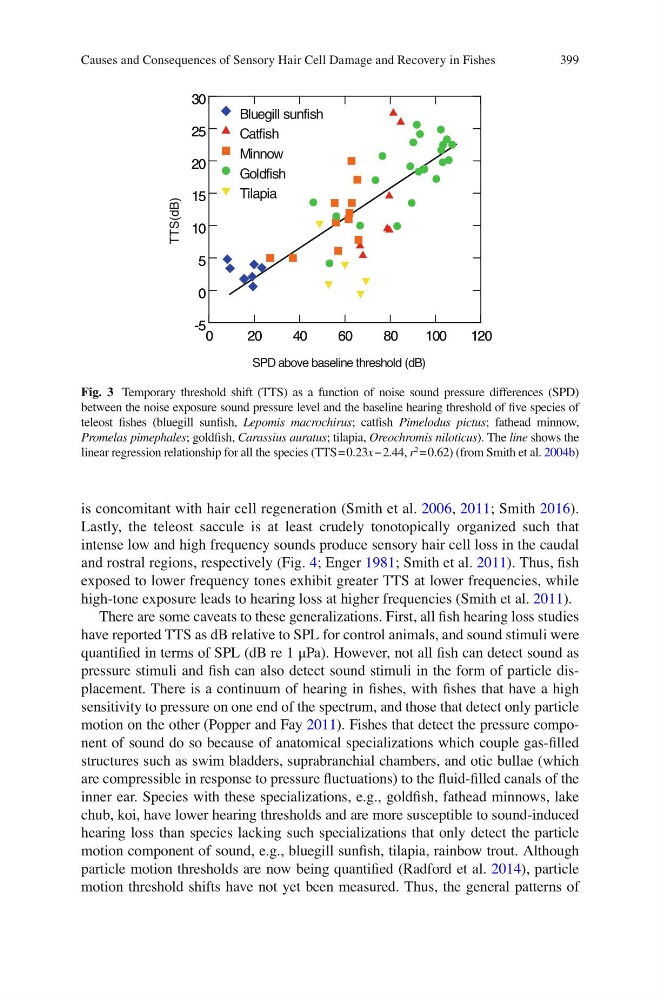
Fig. 3 Temporary threshold shift (TTS) as a function of noise sound pressure differences (SPD)
between the noise exposure sound pressure level and the baseline hearing threshold of fi ve species of
teleost fi shes (bluegill sunfi sh, Lepomis macrochirus ; catfi sh Pimelodus pictus ; fathead minnow,
Promelas pimephales ; goldfi sh, Carassius auratus ; tilapia, Oreochromis niloticus ). The line shows the
linear regression relationship for all the species (TTS = 0.23 x − 2.44, r
2 = 0.62) (from Smith et al. 2004b )
Causes and Consequences of Sensory Hair Cell Damage and Recovery in Fishes
is concomitant with hair cell regeneration (Smith et al. 2006 , 2011 ; Smith 2016 ).
Lastly, the teleost saccule is at least crudely tonotopically organized such that
intense low and high frequency sounds produce sensory hair cell loss in the caudal
and rostral regions, respectively (Fig. 4 ; Enger 1981 ; Smith et al. 2011 ). Thus, fi sh
exposed to lower frequency tones exhibit greater TTS at lower frequencies, while
high-tone exposure leads to hearing loss at higher frequencies (Smith et al. 2011 ).
There are some caveats to these generalizations. First, all fi sh hearing loss studies
have reported TTS as dB relative to SPL for control animals, and sound stimuli were
quantifi ed in terms of SPL (dB re 1 μPa). However, not all fi sh can detect sound as
pressure stimuli and fi sh can also detect sound stimuli in the form of particle displacement. There is a continuum of hearing in fi shes, with fi shes that have a high
sensitivity to pressure on one end of the spectrum, and those that detect only particle
motion on the other (Popper and Fay 2011 ). Fishes that detect the pressure component of sound do so because of anatomical specializations which couple gas- fi lled
structures such as swim bladders, suprabranchial chambers, and otic bullae (which
are compressible in response to pressure fl uctuations) to the fl uid-fi lled canals of the
inner ear. Species with these specializations, e.g., goldfi sh, fathead minnows, lake
chub, koi, have lower hearing thresholds and are more susceptible to sound-induced
hearing loss than species lacking such specializations that only detect the particle
motion component of sound, e.g., bluegill sunfi sh, tilapia, rainbow trout. Although
particle motion thresholds are now being quantifi ed (Radford et al. 2014 ), particle
motion threshold shifts have not yet been measured. Thus, the general patterns of
0
20
40
60
80
100
120
-5
0
5
10
15
20
25
30
0
20
40
60
80
100
120
SPD above baseline threshold (dB)
-5
0
5
10
15
20
25
30
TTS(dB)
Tilapia
Goldfish
Minnow
Catfish
Bluegill sunfish
Fig. 3 Temporary threshold shift (TTS) as a function of noise sound pressure differences (SPD)
between the noise exposure sound pressure level and the baseline hearing threshold of fi ve species of
teleost fi shes (bluegill sunfi sh, Lepomis macrochirus ; catfi sh Pimelodus pictus ; fathead minnow,
Promelas pimephales ; goldfi sh, Carassius auratus ; tilapia, Oreochromis niloticus ). The line shows the
linear regression relationship for all the species (TTS = 0.23 x − 2.44, r
2 = 0.62) (from Smith et al. 2004b )
Causes and Consequences of Sensory Hair Cell Damage and Recovery in Fishes