

281
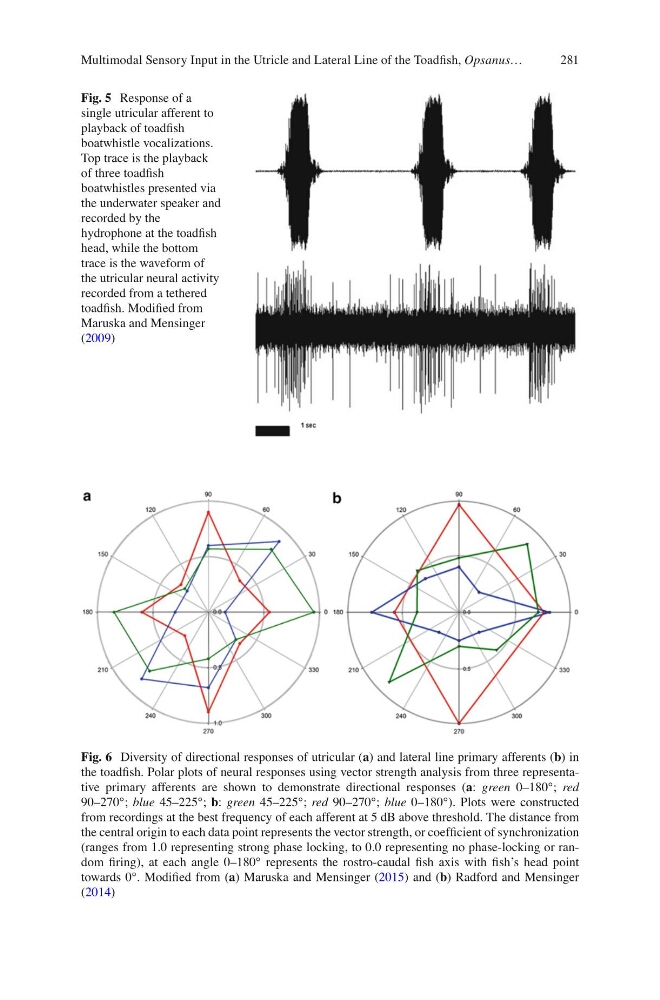
Fig. 5 Response of a
single utricular afferent to
playback of toadfi sh
boatwhistle vocalizations.
Top trace is the playback
of three toadfi sh
boatwhistles presented via
the underwater speaker and
recorded by the
hydrophone at the toadfi sh
head, while the bottom
trace is the waveform of
the utricular neural activity
recorded from a tethered
toadfi sh. Modifi ed from
Maruska and Mensinger
( 2009 )
Fig. 6 Diversity of directional responses of utricular ( a ) and lateral line primary afferents ( b ) in
the toadfi sh. Polar plots of neural responses using vector strength analysis from three representative primary afferents are shown to demonstrate directional responses ( a : green 0–180°; red
90–270°; blue 45–225°; b : green 45–225°; red 90–270°; blue 0–180°). Plots were constructed
from recordings at the best frequency of each afferent at 5 dB above threshold. The distance from
the central origin to each data point represents the vector strength, or coeffi cient of synchronization
(ranges from 1.0 representing strong phase locking, to 0.0 representing no phase-locking or random fi ring), at each angle 0–180° represents the rostro-caudal fi sh axis with fi sh’s head point
towards 0°. Modifi ed from ( a ) Maruska and Mensinger ( 2015 ) and ( b ) Radford and Mensinger
( 2014 )
Multimodal Sensory Input in the Utricle and Lateral Line of the Toadfi sh, Opsanus…
Fig. 5 Response of a
single utricular afferent to
playback of toadfi sh
boatwhistle vocalizations.
Top trace is the playback
of three toadfi sh
boatwhistles presented via
the underwater speaker and
recorded by the
hydrophone at the toadfi sh
head, while the bottom
trace is the waveform of
the utricular neural activity
recorded from a tethered
toadfi sh. Modifi ed from
Maruska and Mensinger
( 2009 )
Fig. 6 Diversity of directional responses of utricular ( a ) and lateral line primary afferents ( b ) in
the toadfi sh. Polar plots of neural responses using vector strength analysis from three representative primary afferents are shown to demonstrate directional responses ( a : green 0–180°; red
90–270°; blue 45–225°; b : green 45–225°; red 90–270°; blue 0–180°). Plots were constructed
from recordings at the best frequency of each afferent at 5 dB above threshold. The distance from
the central origin to each data point represents the vector strength, or coeffi cient of synchronization
(ranges from 1.0 representing strong phase locking, to 0.0 representing no phase-locking or random fi ring), at each angle 0–180° represents the rostro-caudal fi sh axis with fi sh’s head point
towards 0°. Modifi ed from ( a ) Maruska and Mensinger ( 2015 ) and ( b ) Radford and Mensinger
( 2014 )
Multimodal Sensory Input in the Utricle and Lateral Line of the Toadfi sh, Opsanus…