

241
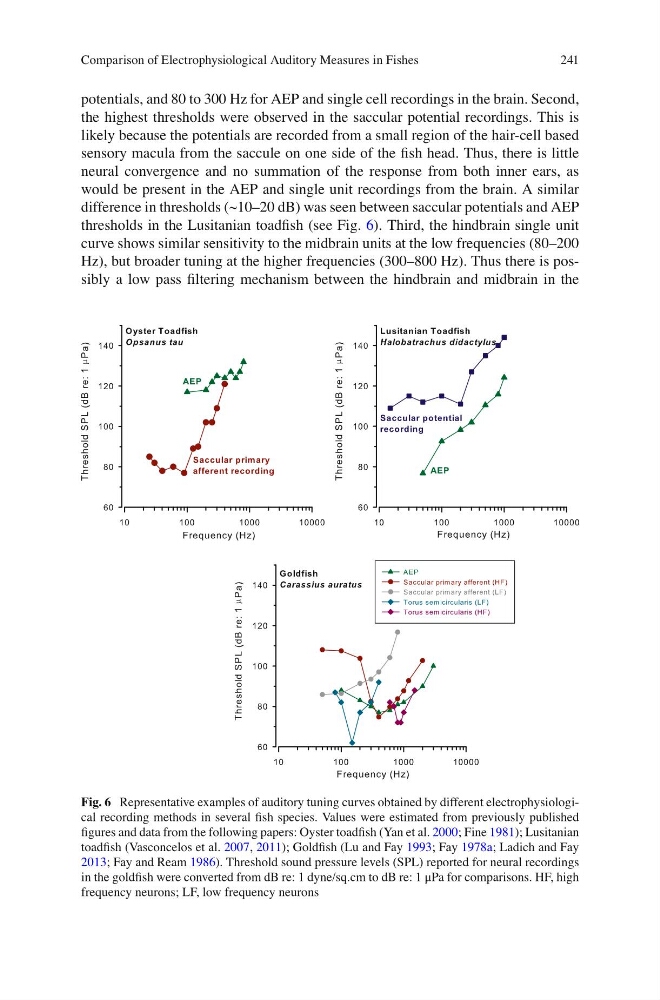
potentials, and 80 to 300 Hz for AEP and single cell recordings in the brain. Second,
the highest thresholds were observed in the saccular potential recordings. This is
likely because the potentials are recorded from a small region of the hair-cell based
sensory macula from the saccule on one side of the fi sh head. Thus, there is little
neural convergence and no summation of the response from both inner ears, as
would be present in the AEP and single unit recordings from the brain. A similar
difference in thresholds (~10–20 dB) was seen between saccular potentials and AEP
thresholds in the Lusitanian toadfi sh (see Fig. 6 ). Third, the hindbrain single unit
curve shows similar sensitivity to the midbrain units at the low frequencies (80–200
Hz), but broader tuning at the higher frequencies (300–800 Hz). Thus there is possibly a low pass fi ltering mechanism between the hindbrain and midbrain in the
Fig. 6 Representative examples of auditory tuning curves obtained by different electrophysiological recording methods in several fi sh species. Values were estimated from previously published
fi gures and data from the following papers: Oyster toadfi sh (Yan et al. 2000 ; Fine 1981 ); Lusitanian
toadfi sh (Vasconcelos et al. 2007 , 2011 ); Goldfi sh (Lu and Fay 1993 ; Fay 1978a ; Ladich and Fay
2013 ; Fay and Ream 1986 ). Threshold sound pressure levels (SPL) reported for neural recordings
in the goldfi sh were converted from dB re: 1 dyne/sq.cm to dB re: 1 μPa for comparisons. HF, high
frequency neurons; LF, low frequency neurons
Comparison of Electrophysiological Auditory Measures in Fishes
potentials, and 80 to 300 Hz for AEP and single cell recordings in the brain. Second,
the highest thresholds were observed in the saccular potential recordings. This is
likely because the potentials are recorded from a small region of the hair-cell based
sensory macula from the saccule on one side of the fi sh head. Thus, there is little
neural convergence and no summation of the response from both inner ears, as
would be present in the AEP and single unit recordings from the brain. A similar
difference in thresholds (~10–20 dB) was seen between saccular potentials and AEP
thresholds in the Lusitanian toadfi sh (see Fig. 6 ). Third, the hindbrain single unit
curve shows similar sensitivity to the midbrain units at the low frequencies (80–200
Hz), but broader tuning at the higher frequencies (300–800 Hz). Thus there is possibly a low pass fi ltering mechanism between the hindbrain and midbrain in the
Fig. 6 Representative examples of auditory tuning curves obtained by different electrophysiological recording methods in several fi sh species. Values were estimated from previously published
fi gures and data from the following papers: Oyster toadfi sh (Yan et al. 2000 ; Fine 1981 ); Lusitanian
toadfi sh (Vasconcelos et al. 2007 , 2011 ); Goldfi sh (Lu and Fay 1993 ; Fay 1978a ; Ladich and Fay
2013 ; Fay and Ream 1986 ). Threshold sound pressure levels (SPL) reported for neural recordings
in the goldfi sh were converted from dB re: 1 dyne/sq.cm to dB re: 1 μPa for comparisons. HF, high
frequency neurons; LF, low frequency neurons
Comparison of Electrophysiological Auditory Measures in Fishes