

240
best sensitivity at low frequencies (≤300 Hz) for all tested fi sh, and there was a 30
dB difference in threshold values between the frequency of best sensitivity (80–125
Hz) and worst sensitivity (800 Hz). AEP thresholds did not differ between 80 and
275 Hz, but these lower frequencies differed from those at 300–600 Hz, and threshold at the highest test frequency (800 Hz) differed from all other frequencies (RM
ANOVA, p < 0.001; F (6,96) = 56.29; Holm–Sidak posthoc comparisons, p < 0.05).
3.3 Comparison of Saccular Potentials, AEPs, and Single
Neuron Recordings in A. abdominalis
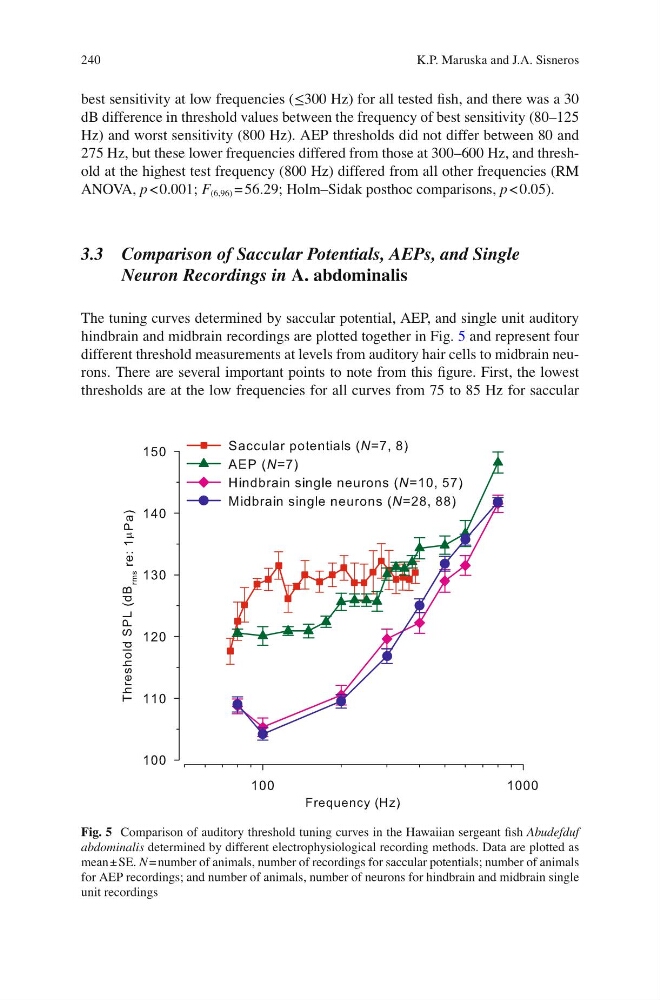
The tuning curves determined by saccular potential, AEP, and single unit auditory
hindbrain and midbrain recordings are plotted together in Fig. 5 and represent four
different threshold measurements at levels from auditory hair cells to midbrain neurons. There are several important points to note from this fi gure. First, the lowest
thresholds are at the low frequencies for all curves from 75 to 85 Hz for saccular
Fig. 5 Comparison of auditory threshold tuning curves in the Hawaiian sergeant fi sh Abudefduf
abdominalis determined by different electrophysiological recording methods. Data are plotted as
mean ± SE. N = number of animals, number of recordings for saccular potentials; number of animals
for AEP recordings; and number of animals, number of neurons for hindbrain and midbrain single
unit recordings
K.P. Maruska and J.A. Sisneros
best sensitivity at low frequencies (≤300 Hz) for all tested fi sh, and there was a 30
dB difference in threshold values between the frequency of best sensitivity (80–125
Hz) and worst sensitivity (800 Hz). AEP thresholds did not differ between 80 and
275 Hz, but these lower frequencies differed from those at 300–600 Hz, and threshold at the highest test frequency (800 Hz) differed from all other frequencies (RM
ANOVA, p < 0.001; F (6,96) = 56.29; Holm–Sidak posthoc comparisons, p < 0.05).
3.3 Comparison of Saccular Potentials, AEPs, and Single
Neuron Recordings in A. abdominalis
The tuning curves determined by saccular potential, AEP, and single unit auditory
hindbrain and midbrain recordings are plotted together in Fig. 5 and represent four
different threshold measurements at levels from auditory hair cells to midbrain neurons. There are several important points to note from this fi gure. First, the lowest
thresholds are at the low frequencies for all curves from 75 to 85 Hz for saccular
Fig. 5 Comparison of auditory threshold tuning curves in the Hawaiian sergeant fi sh Abudefduf
abdominalis determined by different electrophysiological recording methods. Data are plotted as
mean ± SE. N = number of animals, number of recordings for saccular potentials; number of animals
for AEP recordings; and number of animals, number of neurons for hindbrain and midbrain single
unit recordings
K.P. Maruska and J.A. Sisneros