

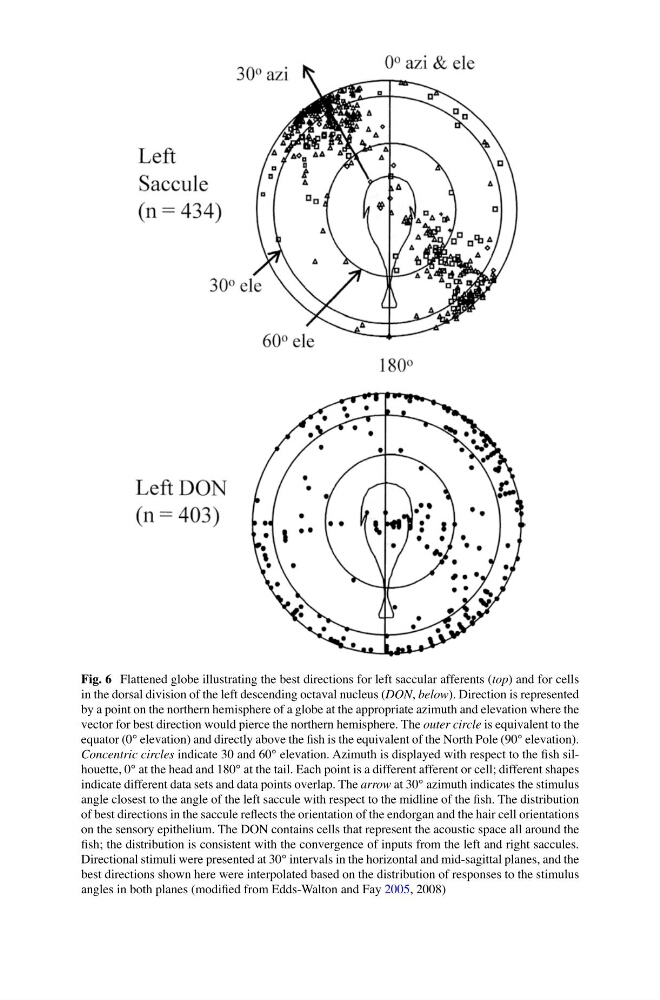
Fig. 6 Flattened globe illustrating the best directions for left saccular afferents (top) and for cells
in the dorsal division of the left descending octaval nucleus (DON, below). Direction is represented
by a point on the northern hemisphere of a globe at the appropriate azimuth and elevation where the
vector for best direction would pierce the northern hemisphere. The outer circle is equivalent to the
equator (0° elevation) and directly above the fish is the equivalent of the North Pole (90° elevation).
Concentric circles indicate 30 and 60° elevation. Azimuth is displayed with respect to the fish silhouette, 0° at the head and 180° at the tail. Each point is a different afferent or cell; different shapes
indicate different data sets and data points overlap. The arrow at 30° azimuth indicates the stimulus
angle closest to the angle of the left saccule with respect to the midline of the fish. The distribution
of best directions in the saccule reflects the orientation of the endorgan and the hair cell orientations
on the sensory epithelium. The DON contains cells that represent the acoustic space all around the
fish; the distribution is consistent with the convergence of inputs from the left and right saccules.
Directional stimuli were presented at 30° intervals in the horizontal and mid-sagittal planes, and the
best directions shown here were interpolated based on the distribution of responses to the stimulus
angles in both planes (modified from Edds-Walton and Fay 2005, 2008)
in the dorsal division of the left descending octaval nucleus (DON, below). Direction is represented
by a point on the northern hemisphere of a globe at the appropriate azimuth and elevation where the
vector for best direction would pierce the northern hemisphere. The outer circle is equivalent to the
equator (0° elevation) and directly above the fish is the equivalent of the North Pole (90° elevation).
Concentric circles indicate 30 and 60° elevation. Azimuth is displayed with respect to the fish silhouette, 0° at the head and 180° at the tail. Each point is a different afferent or cell; different shapes
indicate different data sets and data points overlap. The arrow at 30° azimuth indicates the stimulus
angle closest to the angle of the left saccule with respect to the midline of the fish. The distribution
of best directions in the saccule reflects the orientation of the endorgan and the hair cell orientations
on the sensory epithelium. The DON contains cells that represent the acoustic space all around the
fish; the distribution is consistent with the convergence of inputs from the left and right saccules.
Directional stimuli were presented at 30° intervals in the horizontal and mid-sagittal planes, and the
best directions shown here were interpolated based on the distribution of responses to the stimulus
angles in both planes (modified from Edds-Walton and Fay 2005, 2008)