

216
Percent of cells (each site, plane)
0%
10%
20%
30%
40%
50%
60%
70%
0.76-1.0
0.56 - 0.75
0.10-0.55
DON azi
TS azi
DON ele
TS ele
SR value -----increasingly narrow DRP
30 o
0
180
-30 o
R 3 = 100 spikes
R 1 = 84 spikes
R 2 = 80 spikes
a SR = [ (84+80)/2] = 0.82, unsharpened cell
100
R 3 = 100 spikes
R 1 = 64 spikes
R 2 = 68 spikes
30 o
0
180
-30 o
b SR = [ (64+68)/2] = 0.66, sharpened cell
100
c Distribution of SR values in DON and TS
circle = 100 spikes
Best axis
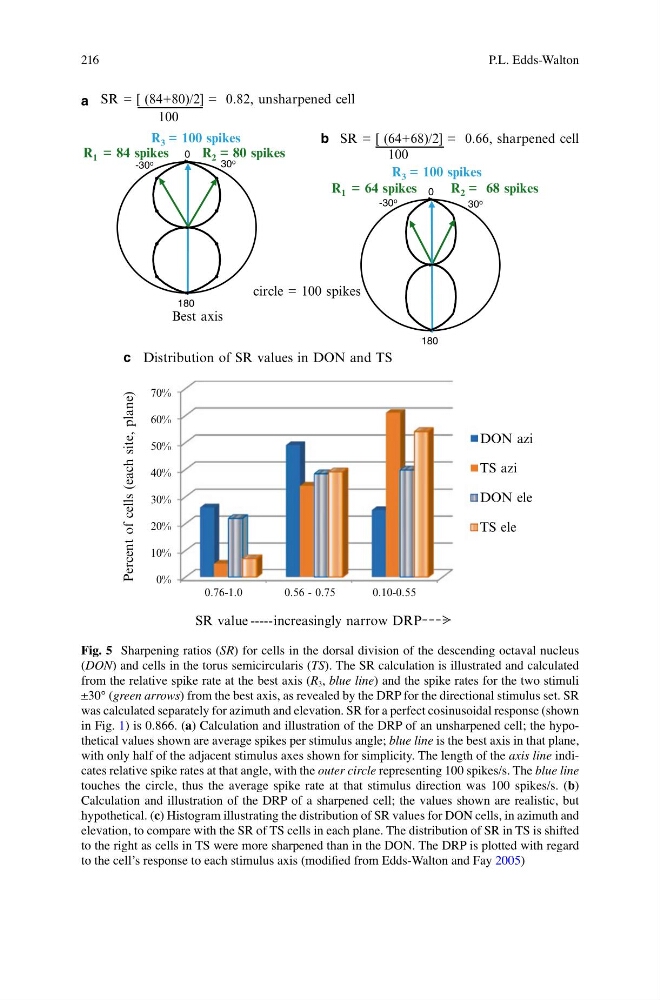
Fig. 5 Sharpening ratios (SR) for cells in the dorsal division of the descending octaval nucleus
(DON) and cells in the torus semicircularis (TS). The SR calculation is illustrated and calculated
from the relative spike rate at the best axis (R 3 , blue line) and the spike rates for the two stimuli
±30° (green arrows) from the best axis, as revealed by the DRP for the directional stimulus set. SR
was calculated separately for azimuth and elevation. SR for a perfect cosinusoidal response (shown
in Fig. 1) is 0.866. (a) Calculation and illustration of the DRP of an unsharpened cell; the hypothetical values shown are average spikes per stimulus angle; blue line is the best axis in that plane,
with only half of the adjacent stimulus axes shown for simplicity. The length of the axis line indicates relative spike rates at that angle, with the outer circle representing 100 spikes/s. The blue line
touches the circle, thus the average spike rate at that stimulus direction was 100 spikes/s. (b)
Calculation and illustration of the DRP of a sharpened cell; the values shown are realistic, but
hypothetical. (c) Histogram illustrating the distribution of SR values for DON cells, in azimuth and
elevation, to compare with the SR of TS cells in each plane. The distribution of SR in TS is shifted
to the right as cells in TS were more sharpened than in the DON. The DRP is plotted with regard
to the cell’s response to each stimulus axis (modified from Edds-Walton and Fay 2005)
P.L. Edds-Walton
Percent of cells (each site, plane)
0%
10%
20%
30%
40%
50%
60%
70%
0.76-1.0
0.56 - 0.75
0.10-0.55
DON azi
TS azi
DON ele
TS ele
SR value -----increasingly narrow DRP
30 o
0
180
-30 o
R 3 = 100 spikes
R 1 = 84 spikes
R 2 = 80 spikes
a SR = [ (84+80)/2] = 0.82, unsharpened cell
100
R 3 = 100 spikes
R 1 = 64 spikes
R 2 = 68 spikes
30 o
0
180
-30 o
b SR = [ (64+68)/2] = 0.66, sharpened cell
100
c Distribution of SR values in DON and TS
circle = 100 spikes
Best axis
Fig. 5 Sharpening ratios (SR) for cells in the dorsal division of the descending octaval nucleus
(DON) and cells in the torus semicircularis (TS). The SR calculation is illustrated and calculated
from the relative spike rate at the best axis (R 3 , blue line) and the spike rates for the two stimuli
±30° (green arrows) from the best axis, as revealed by the DRP for the directional stimulus set. SR
was calculated separately for azimuth and elevation. SR for a perfect cosinusoidal response (shown
in Fig. 1) is 0.866. (a) Calculation and illustration of the DRP of an unsharpened cell; the hypothetical values shown are average spikes per stimulus angle; blue line is the best axis in that plane,
with only half of the adjacent stimulus axes shown for simplicity. The length of the axis line indicates relative spike rates at that angle, with the outer circle representing 100 spikes/s. The blue line
touches the circle, thus the average spike rate at that stimulus direction was 100 spikes/s. (b)
Calculation and illustration of the DRP of a sharpened cell; the values shown are realistic, but
hypothetical. (c) Histogram illustrating the distribution of SR values for DON cells, in azimuth and
elevation, to compare with the SR of TS cells in each plane. The distribution of SR in TS is shifted
to the right as cells in TS were more sharpened than in the DON. The DRP is plotted with regard
to the cell’s response to each stimulus axis (modified from Edds-Walton and Fay 2005)
P.L. Edds-Walton