

149
and the surface is much smaller than a wavelength, then the source and its negative
image source create a dipole. From our analysis of dipole sources it follows that the
time averaged intensity vector will usually point not away from the source but away
from a point on the surface directly above the source which is the center of the
dipole. The azimuth angle will be correct but the elevation angle will not be.
For sources at larger distance the same thing is true with the elevation angle being
correct when the field point is close to the source and moving towards the surface as
the field point approaches the surface.
The very shallow water (~0.5 m) where the midshipman fish nest is an extremely
unusual and difficult acoustic environment to model for sound propagation,
especially at the male’s advertisement frequency of 70–100 Hz (wavelength
0
1
2
3
4
5
6
7
−1
−0.8
−0.6
−0.4
−0.2
0
0.2
0.4
0.6
0.8
1
Range(m)
Re (pv*)/ |pv|
Intensity Ratio
80 Hz (Model)
90 Hz (Model)
1000 Hz (Model)
80 Hz (Measured Bodega Bay)
90 Hz (Measured Bodega Bay)
1000 Hz (Measured Bodega Bay)
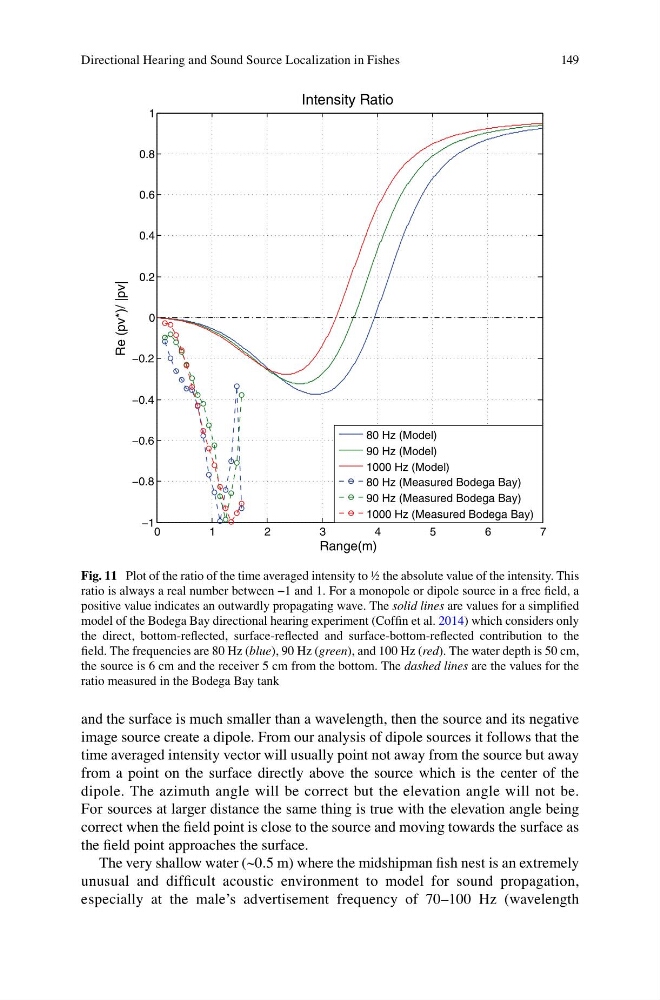
Fig. 11 Plot of the ratio of the time averaged intensity to ½ the absolute value of the intensity. This
ratio is always a real number between −1 and 1. For a monopole or dipole source in a free field, a
positive value indicates an outwardly propagating wave. The solid lines are values for a simplified
model of the Bodega Bay directional hearing experiment (Coffin et al. 2014) which considers only
the direct, bottom-reflected, surface-reflected and surface-bottom-reflected contribution to the
field. The frequencies are 80 Hz (blue), 90 Hz (green), and 100 Hz (red). The water depth is 50 cm,
the source is 6 cm and the receiver 5 cm from the bottom. The dashed lines are the values for the
ratio measured in the Bodega Bay tank
Directional Hearing and Sound Source Localization in Fishes
and the surface is much smaller than a wavelength, then the source and its negative
image source create a dipole. From our analysis of dipole sources it follows that the
time averaged intensity vector will usually point not away from the source but away
from a point on the surface directly above the source which is the center of the
dipole. The azimuth angle will be correct but the elevation angle will not be.
For sources at larger distance the same thing is true with the elevation angle being
correct when the field point is close to the source and moving towards the surface as
the field point approaches the surface.
The very shallow water (~0.5 m) where the midshipman fish nest is an extremely
unusual and difficult acoustic environment to model for sound propagation,
especially at the male’s advertisement frequency of 70–100 Hz (wavelength
0
1
2
3
4
5
6
7
−1
−0.8
−0.6
−0.4
−0.2
0
0.2
0.4
0.6
0.8
1
Range(m)
Re (pv*)/ |pv|
Intensity Ratio
80 Hz (Model)
90 Hz (Model)
1000 Hz (Model)
80 Hz (Measured Bodega Bay)
90 Hz (Measured Bodega Bay)
1000 Hz (Measured Bodega Bay)
Fig. 11 Plot of the ratio of the time averaged intensity to ½ the absolute value of the intensity. This
ratio is always a real number between −1 and 1. For a monopole or dipole source in a free field, a
positive value indicates an outwardly propagating wave. The solid lines are values for a simplified
model of the Bodega Bay directional hearing experiment (Coffin et al. 2014) which considers only
the direct, bottom-reflected, surface-reflected and surface-bottom-reflected contribution to the
field. The frequencies are 80 Hz (blue), 90 Hz (green), and 100 Hz (red). The water depth is 50 cm,
the source is 6 cm and the receiver 5 cm from the bottom. The dashed lines are the values for the
ratio measured in the Bodega Bay tank
Directional Hearing and Sound Source Localization in Fishes