

234
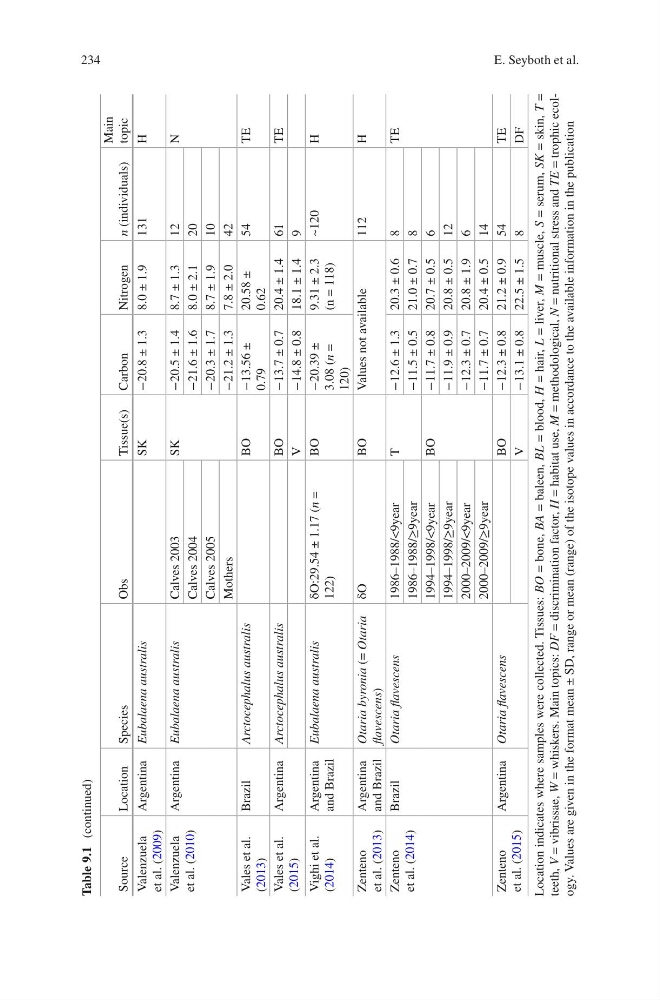
Table 9.1 (continued)
Source
Location
Species
Obs
Tissue(s) Carbon
Nitrogen
n
(individuals)
Main
topic
Valenzuela
et al. (2009)
Argentina Eubalaena australis
SK
−20.8 ± 1.3
8.0 ± 1.9
131
H
Valenzuela
et al. (2010)
Argentina Eubalaena australis
Calves 2003
SK
−20.5 ± 1.4
8.7 ± 1.3
12
N
Calves 2004
−21.6 ± 1.6
8.0 ± 2.1
20
Calves 2005
−20.3 ± 1.7
8.7 ± 1.9
10
Mothers
−21.2 ± 1.3
7.8 ± 2.0
42
Vales et al.
(2013)
Brazil
Arctocephalus australis
BO
−13.56 ±
0.79
20.58 ±
0.62
54
TE
Vales et al.
(2015)
Argentina Arctocephalus australis
BO
−13.7 ± 0.7
20.4 ± 1.4
61
TE
V
−14.8 ± 0.8
18.1 ± 1.4
9
Vighi et al.
(2014)
Argentina
and Brazil
Eubalaena australis
δΟ:29.54 ± 1.17 (n =
122)
BO
−20.39 ±
3.08 (n =
120)
9.31 ± 2.3
(n = 118)
~120
H
Zenteno
et al. (2013)
Argentina
and Brazil
Otaria byronia
(= Otaria
flavescens)
δΟ
BO
Values not available
112
H
Zenteno
et al. (2014)
Brazil
Otaria flavescens
1986–1988/<9year
T
−12.6 ± 1.3
20.3 ± 0.6
8
TE
1986–1988/≥9year
−11.5 ± 0.5
21.0 ± 0.7
8
1994–1998/<9year
BO
−11.7 ± 0.8
20.7 ± 0.5
6
1994–1998/≥9year
−11.9 ± 0.9
20.8 ± 0.5
12
2000–2009/<9year
−12.3 ± 0.7
20.8 ± 1.9
6
2000–2009/≥9year
−11.7 ± 0.7
20.4 ± 0.5
14
Zenteno
et al. (2015)
Argentina Otaria flavescens
BO
−12.3 ± 0.8
21.2 ± 0.9
54
TE
V
−13.1 ± 0.8
22.5 ± 1.5
8
DF
Location indicates where samples were collected. Tissues: BO =
bone, BA =
baleen, BL =
blood, H =
hair, L =
liver, M =
muscle, S =
serum, SK =
skin, T =
teeth, V =
vibrissae, W =
whiskers. Main topics: DF =
discrimination factor, H =
habitat use, M =
methodological, N =
nutritional stress and TE =
trophic ecology. Values are given in the format mean ± SD, range or mean (range) of the isotope values in accordance to the available information in the publication
E. Seyboth et al.
Table 9.1 (continued)
Source
Location
Species
Obs
Tissue(s) Carbon
Nitrogen
n
(individuals)
Main
topic
Valenzuela
et al. (2009)
Argentina Eubalaena australis
SK
−20.8 ± 1.3
8.0 ± 1.9
131
H
Valenzuela
et al. (2010)
Argentina Eubalaena australis
Calves 2003
SK
−20.5 ± 1.4
8.7 ± 1.3
12
N
Calves 2004
−21.6 ± 1.6
8.0 ± 2.1
20
Calves 2005
−20.3 ± 1.7
8.7 ± 1.9
10
Mothers
−21.2 ± 1.3
7.8 ± 2.0
42
Vales et al.
(2013)
Brazil
Arctocephalus australis
BO
−13.56 ±
0.79
20.58 ±
0.62
54
TE
Vales et al.
(2015)
Argentina Arctocephalus australis
BO
−13.7 ± 0.7
20.4 ± 1.4
61
TE
V
−14.8 ± 0.8
18.1 ± 1.4
9
Vighi et al.
(2014)
Argentina
and Brazil
Eubalaena australis
δΟ:29.54 ± 1.17 (n =
122)
BO
−20.39 ±
3.08 (n =
120)
9.31 ± 2.3
(n = 118)
~120
H
Zenteno
et al. (2013)
Argentina
and Brazil
Otaria byronia
(= Otaria
flavescens)
δΟ
BO
Values not available
112
H
Zenteno
et al. (2014)
Brazil
Otaria flavescens
1986–1988/<9year
T
−12.6 ± 1.3
20.3 ± 0.6
8
TE
1986–1988/≥9year
−11.5 ± 0.5
21.0 ± 0.7
8
1994–1998/<9year
BO
−11.7 ± 0.8
20.7 ± 0.5
6
1994–1998/≥9year
−11.9 ± 0.9
20.8 ± 0.5
12
2000–2009/<9year
−12.3 ± 0.7
20.8 ± 1.9
6
2000–2009/≥9year
−11.7 ± 0.7
20.4 ± 0.5
14
Zenteno
et al. (2015)
Argentina Otaria flavescens
BO
−12.3 ± 0.8
21.2 ± 0.9
54
TE
V
−13.1 ± 0.8
22.5 ± 1.5
8
DF
Location indicates where samples were collected. Tissues: BO =
bone, BA =
baleen, BL =
blood, H =
hair, L =
liver, M =
muscle, S =
serum, SK =
skin, T =
teeth, V =
vibrissae, W =
whiskers. Main topics: DF =
discrimination factor, H =
habitat use, M =
methodological, N =
nutritional stress and TE =
trophic ecology. Values are given in the format mean ± SD, range or mean (range) of the isotope values in accordance to the available information in the publication
E. Seyboth et al.