

466
JORN KOCH
stained with an efficiency of 99.8% (Fig. 2). In such cases, it is preferable to
measure the light intensities of the signals instead. We have described a
procedure for this, employing the preexisting image analysis program
QUIPS from VYSIS for the purpose (Krejci and Koch 1998). Currently,
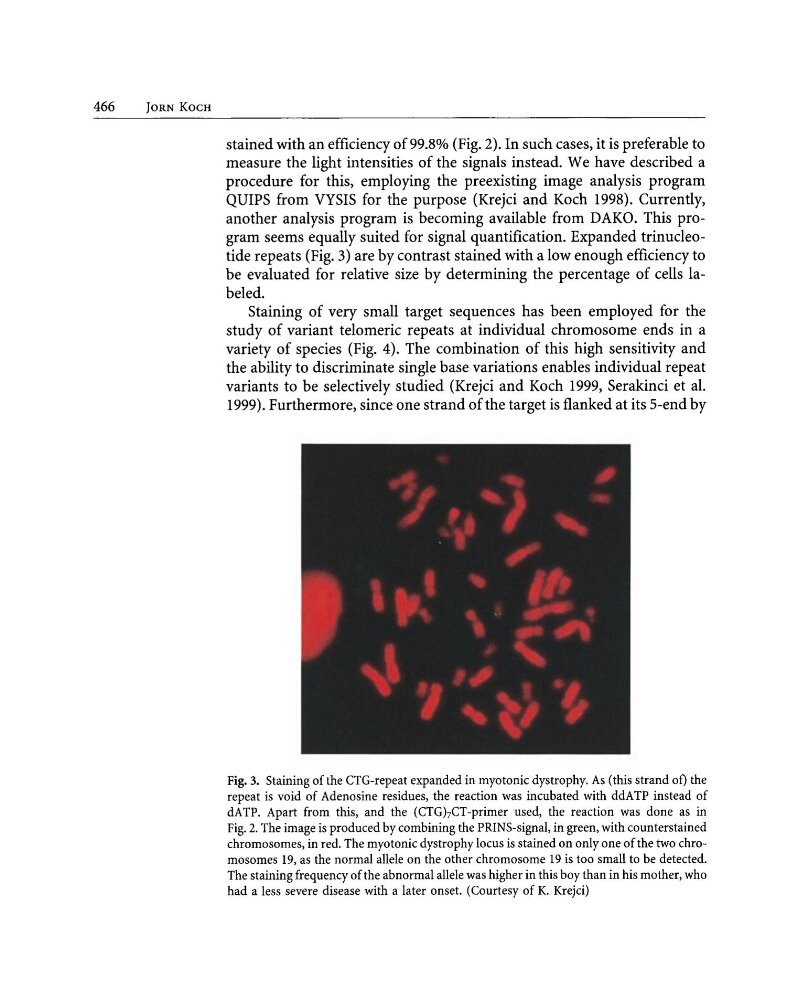
another analysis program is becoming available from DAKO. This program seems equally suited for signal quantification. Expanded trinucleotide repeats (Fig. 3) are by contrast stained with a low enough efficiency to
be evaluated for relative size by determining the percentage of cells labeled.
Staining of very small target sequences has been employed for the
study of variant telomeric repeats at individual chromosome ends in a
variety of species (Fig. 4). The combination of this high sensitivity and
the ability to discriminate single base variations enables individual repeat
variants to be selectively studied (Krejci and Koch 1999, Serakinci et al.
1999). Furthermore, since one strand of the target is flanked at its 5-end by
Fig. 3. Staining of the CTG-repeat expanded in myotonic dystrophy. As (this strand of) the
repeat is void of Adenosine residues, the reaction was incubated with ddATP instead of
dATP. Apart from this, and the (CTGhCT-primer used, the reaction was done as in
Fig. 2. The image is produced by combining the PRINS-signal, in green, with counterstained
chromosomes, in red. The myotonic dystrophy locus is stained on only one of the two chromosomes 19, as the normal allele on the other chromosome 19 is too small to be detected.
The staining frequency of the abnormal allele was higher in this boy than in his mother, who
had a less severe disease with a later onset. (Courtesy of K. Krejci)
JORN KOCH
stained with an efficiency of 99.8% (Fig. 2). In such cases, it is preferable to
measure the light intensities of the signals instead. We have described a
procedure for this, employing the preexisting image analysis program
QUIPS from VYSIS for the purpose (Krejci and Koch 1998). Currently,
another analysis program is becoming available from DAKO. This program seems equally suited for signal quantification. Expanded trinucleotide repeats (Fig. 3) are by contrast stained with a low enough efficiency to
be evaluated for relative size by determining the percentage of cells labeled.
Staining of very small target sequences has been employed for the
study of variant telomeric repeats at individual chromosome ends in a
variety of species (Fig. 4). The combination of this high sensitivity and
the ability to discriminate single base variations enables individual repeat
variants to be selectively studied (Krejci and Koch 1999, Serakinci et al.
1999). Furthermore, since one strand of the target is flanked at its 5-end by
Fig. 3. Staining of the CTG-repeat expanded in myotonic dystrophy. As (this strand of) the
repeat is void of Adenosine residues, the reaction was incubated with ddATP instead of
dATP. Apart from this, and the (CTGhCT-primer used, the reaction was done as in
Fig. 2. The image is produced by combining the PRINS-signal, in green, with counterstained
chromosomes, in red. The myotonic dystrophy locus is stained on only one of the two chromosomes 19, as the normal allele on the other chromosome 19 is too small to be detected.
The staining frequency of the abnormal allele was higher in this boy than in his mother, who
had a less severe disease with a later onset. (Courtesy of K. Krejci)