

23 Detection of Radiosensitivity by Means of Three-Color FISH
297
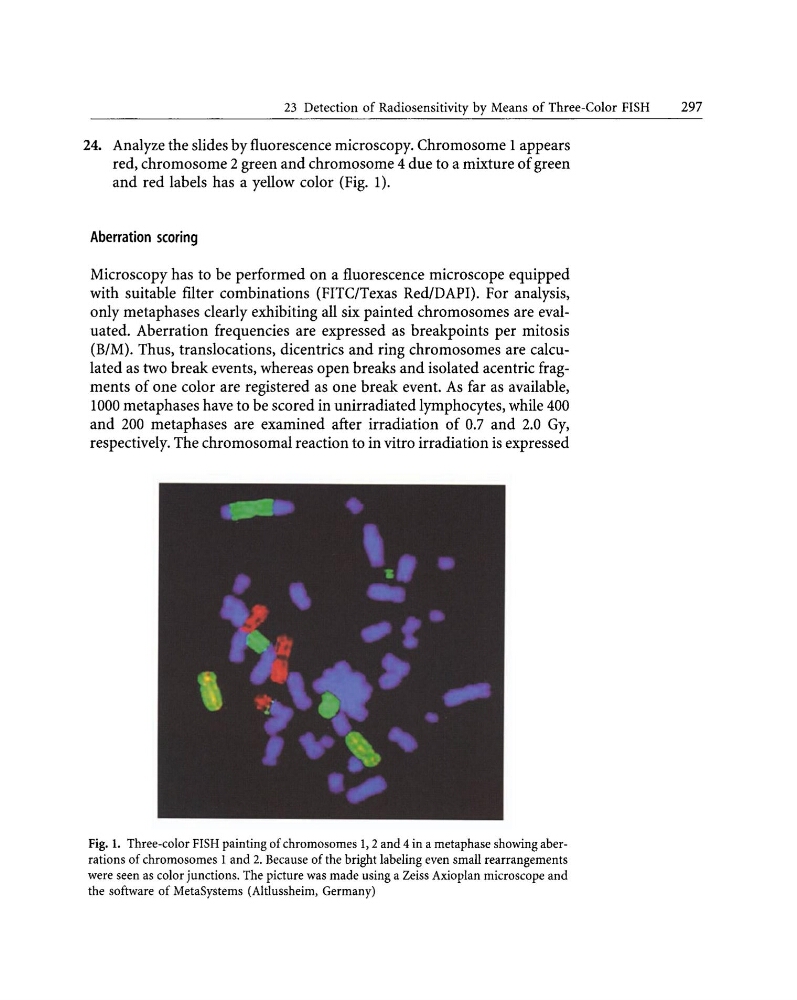
24. Analyze the slides by fluorescence microscopy. Chromosome 1 appears
red, chromosome 2 green and chromosome 4 due to a mixture of green
and red labels has a yellow color (Fig. 1).
Aberration scoring
Microscopy has to be performed on a fluorescence microscope equipped
with suitable filter combinations (FITC/Texas RedIDAPI). For analysis,
only metaphases dearly exhibiting all six painted chromosomes are evaluated. Aberration frequencies are expressed as breakpoints per mitosis
(B/M). Thus, translocations, dicentrics and ring chromosomes are calculated as two break events, whereas open breaks and isolated acentric fragments of one color are registered as one break event. As far as available,
1000 metaphases have to be scored in unirradiated lymphocytes, while 400
and 200 metaphases are examined after irradiation of 0.7 and 2.0 Gy,
respectively. The chromosomal reaction to in vitro irradiation is expressed
Fig. 1. Three-color FISH painting of chromosomes 1,2 and 4 in a metaphase showing aberrations of chromosomes 1 and 2. Because of the bright labeling even small rearrangements
were seen as color junctions. The picture was made using a Zeiss Axioplan microscope and
the software of MetaSystems (Altlussheim, Germany)
297
24. Analyze the slides by fluorescence microscopy. Chromosome 1 appears
red, chromosome 2 green and chromosome 4 due to a mixture of green
and red labels has a yellow color (Fig. 1).
Aberration scoring
Microscopy has to be performed on a fluorescence microscope equipped
with suitable filter combinations (FITC/Texas RedIDAPI). For analysis,
only metaphases dearly exhibiting all six painted chromosomes are evaluated. Aberration frequencies are expressed as breakpoints per mitosis
(B/M). Thus, translocations, dicentrics and ring chromosomes are calculated as two break events, whereas open breaks and isolated acentric fragments of one color are registered as one break event. As far as available,
1000 metaphases have to be scored in unirradiated lymphocytes, while 400
and 200 metaphases are examined after irradiation of 0.7 and 2.0 Gy,
respectively. The chromosomal reaction to in vitro irradiation is expressed
Fig. 1. Three-color FISH painting of chromosomes 1,2 and 4 in a metaphase showing aberrations of chromosomes 1 and 2. Because of the bright labeling even small rearrangements
were seen as color junctions. The picture was made using a Zeiss Axioplan microscope and
the software of MetaSystems (Altlussheim, Germany)