

68
G. Duhamel
B. tenuis
%
1.0
3.9
4.5
A
4.8
25.0
37.7
N. coatsi
%
1.5
0.7
0.5
1.0
0.6
A
1.0
1.1
2.3
6.3
4.9
S. boa
%
0.4
1.6
1.4
1.2
A
8.1
7.5
8.7
9.4
M. marmoratus %
48.1 18.9
3J
OJ
5.8
1.6
13.4
A
43.4 13.1
5.4
5.3
27.3
10.0 109.4
L. squamifrons %
97.5
7.1 16.9
5.4
0.1
0.5
0.4
0.4
A
167.1
6.4 11.7 8.8
1.6
2.3
2.7
2.9
P. gracilis
%
0.1
0.5
OJ
0.4
A
1.2
2.3
1.7
3.4
others
%
0.7
0.8
5.0
1.0
0.0
0.2
0.2
0.4
A
1.1
0.7
1.0
0.4
0.6
1.0
1.3
3.1
Circadian Changes
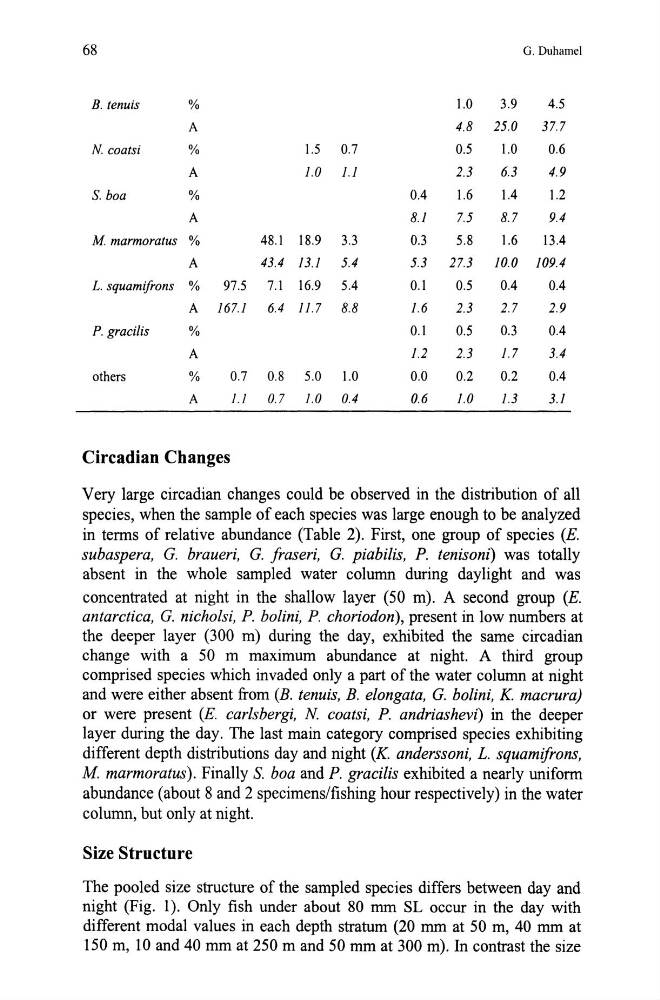
Very large circadian changes could be observed in the distribution of all
species, when the sample of each species was large enough to be analyzed
in terms of relative abundance (Table 2). First, one group of species (E.
subaspera, G. braueri, G. jraseri, G. piabilis, P. tenisoni) was totally
absent in the whole sampled water column during daylight and was
concentrated at night in the shallow layer (50 m). A second group (E.
antarctica, G. nicholsi, P. bolini, P. choriodon), present in low numbers at
the deeper layer (300 m) during the day, exhibited the same circadian
change with a 50 m maximum abundance at night. A third group
comprised species which invaded only a part of the water column at night
and were either absent from (B. tenuis, B. elongata, G. bolini, K. macrura)
or were present (E. carlsbergi, N coatsi, P. andriashevi) in the deeper
layer during the day. The last main category comprised species exhibiting
different depth distributions day and night (K. anderssoni, L. squamifrons,
M. marmoratus). Finally S. boa and P. gracilis exhibited a nearly uniform
abundance (about 8 and 2 specimens/fishing hour respectively) in the water
column, but only at night.
Size Structure
The pooled size structure of the sampled species differs between day and
night (Fig. 1). Only fish under about 80 mm SL occur in the day with
different modal values in each depth stratum (20 mm at 50 m, 40 mm at
150 m, 10 and 40 mm at 250 m and 50 mm at 300 m). In contrast the size
G. Duhamel
B. tenuis
%
1.0
3.9
4.5
A
4.8
25.0
37.7
N. coatsi
%
1.5
0.7
0.5
1.0
0.6
A
1.0
1.1
2.3
6.3
4.9
S. boa
%
0.4
1.6
1.4
1.2
A
8.1
7.5
8.7
9.4
M. marmoratus %
48.1 18.9
3J
OJ
5.8
1.6
13.4
A
43.4 13.1
5.4
5.3
27.3
10.0 109.4
L. squamifrons %
97.5
7.1 16.9
5.4
0.1
0.5
0.4
0.4
A
167.1
6.4 11.7 8.8
1.6
2.3
2.7
2.9
P. gracilis
%
0.1
0.5
OJ
0.4
A
1.2
2.3
1.7
3.4
others
%
0.7
0.8
5.0
1.0
0.0
0.2
0.2
0.4
A
1.1
0.7
1.0
0.4
0.6
1.0
1.3
3.1
Circadian Changes
Very large circadian changes could be observed in the distribution of all
species, when the sample of each species was large enough to be analyzed
in terms of relative abundance (Table 2). First, one group of species (E.
subaspera, G. braueri, G. jraseri, G. piabilis, P. tenisoni) was totally
absent in the whole sampled water column during daylight and was
concentrated at night in the shallow layer (50 m). A second group (E.
antarctica, G. nicholsi, P. bolini, P. choriodon), present in low numbers at
the deeper layer (300 m) during the day, exhibited the same circadian
change with a 50 m maximum abundance at night. A third group
comprised species which invaded only a part of the water column at night
and were either absent from (B. tenuis, B. elongata, G. bolini, K. macrura)
or were present (E. carlsbergi, N coatsi, P. andriashevi) in the deeper
layer during the day. The last main category comprised species exhibiting
different depth distributions day and night (K. anderssoni, L. squamifrons,
M. marmoratus). Finally S. boa and P. gracilis exhibited a nearly uniform
abundance (about 8 and 2 specimens/fishing hour respectively) in the water
column, but only at night.
Size Structure
The pooled size structure of the sampled species differs between day and
night (Fig. 1). Only fish under about 80 mm SL occur in the day with
different modal values in each depth stratum (20 mm at 50 m, 40 mm at
150 m, 10 and 40 mm at 250 m and 50 mm at 300 m). In contrast the size