

225
A
.30
.25
~f t!~~HjiHI If!
f f!
.20
.....
Ul
-....
'C
c. .15
.;:
t
....
t
I I
\
I
#
ro
I
c...
I \ I
.10
I
I
II II
I
.05
I
0
8
0.15
f
.....
II
Ul
ij It !!f !
-.... 0.10
.c
f
CJ
.~
.... ro
c...
0.05
0.00 '---_ _ _ _ _ -'--_ _ _ _ _ - L -_ _ _ _ _ - - - ' - _ - - - '
c
0 . 2 0 , - - - - - - - - - - - - - - - - - - - - - ,
0.00'-------<-------<------_<--_-1
B
13
1B
23
standard length (mm)
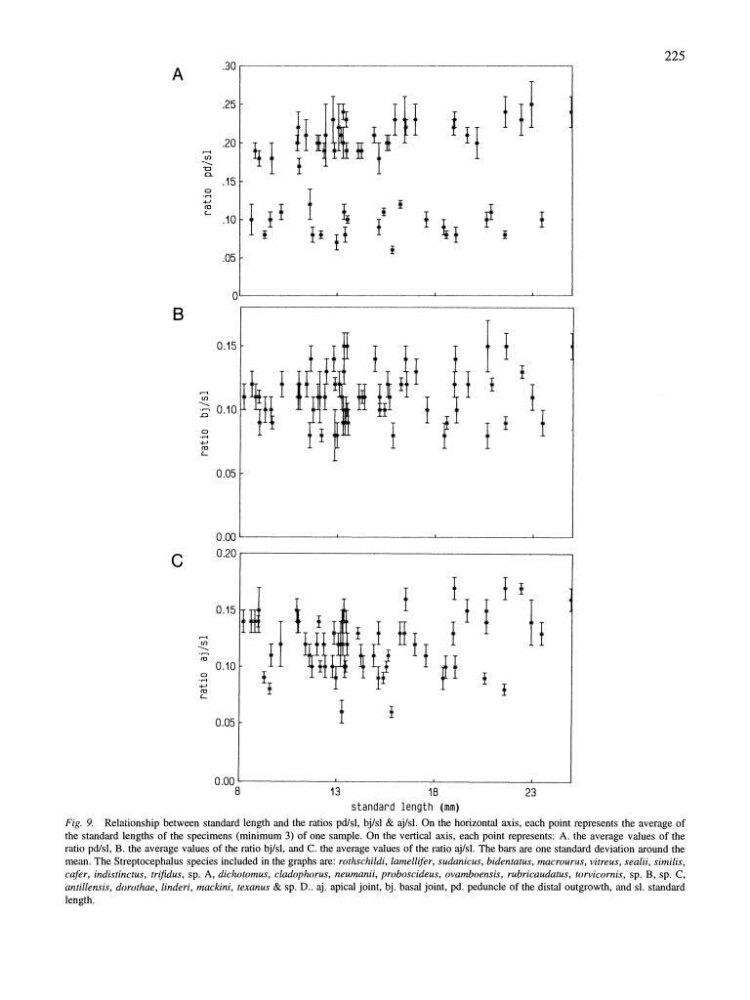
Fig. 9. Relationship between standard length and the ratios pdlsl, bjlsl & ajlsl. On the horizontal axis, each point represents the average of
the standard lengths of the specimens (minimum 3) of one sample. On the vertical axis, each point represents: A. the average values of the
ratio pdlsl, B. the average values of the ratio bjlsl, and C. the average values of the ratio ajlsl. The bars are one standard deviation around the
mean. The Streptocephalus species included in the graphs are: rothschildi, lamellifer, sudanicus, bidentatus, macrourus, vitreus, sealii, similis,
cofer, indistinctus, trijidus, sp. A, dichotomus, cladophorus, neumanii, proboscideus, ovamboensis, rubricaudatus, torvicornis, sp. B, sp. C,
antillensis, dorothae, linderi, mackini, texanus & sp. D .. aj. apical joint, bj. basal joint, pd. peduncle of the distal outgrowth, and sl. standard
length.
A
.30
.25
~f t!~~HjiHI If!
f f!
.20
.....
Ul
-....
'C
c. .15
.;:
t
....
t
I I
\
I
#
ro
I
c...
I \ I
.10
I
I
II II
I
.05
I
0
8
0.15
f
.....
II
Ul
ij It !!f !
-.... 0.10
.c
f
CJ
.~
.... ro
c...
0.05
0.00 '---_ _ _ _ _ -'--_ _ _ _ _ - L -_ _ _ _ _ - - - ' - _ - - - '
c
0 . 2 0 , - - - - - - - - - - - - - - - - - - - - - ,
0.00'-------<-------<------_<--_-1
B
13
1B
23
standard length (mm)
Fig. 9. Relationship between standard length and the ratios pdlsl, bjlsl & ajlsl. On the horizontal axis, each point represents the average of
the standard lengths of the specimens (minimum 3) of one sample. On the vertical axis, each point represents: A. the average values of the
ratio pdlsl, B. the average values of the ratio bjlsl, and C. the average values of the ratio ajlsl. The bars are one standard deviation around the
mean. The Streptocephalus species included in the graphs are: rothschildi, lamellifer, sudanicus, bidentatus, macrourus, vitreus, sealii, similis,
cofer, indistinctus, trijidus, sp. A, dichotomus, cladophorus, neumanii, proboscideus, ovamboensis, rubricaudatus, torvicornis, sp. B, sp. C,
antillensis, dorothae, linderi, mackini, texanus & sp. D .. aj. apical joint, bj. basal joint, pd. peduncle of the distal outgrowth, and sl. standard
length.