

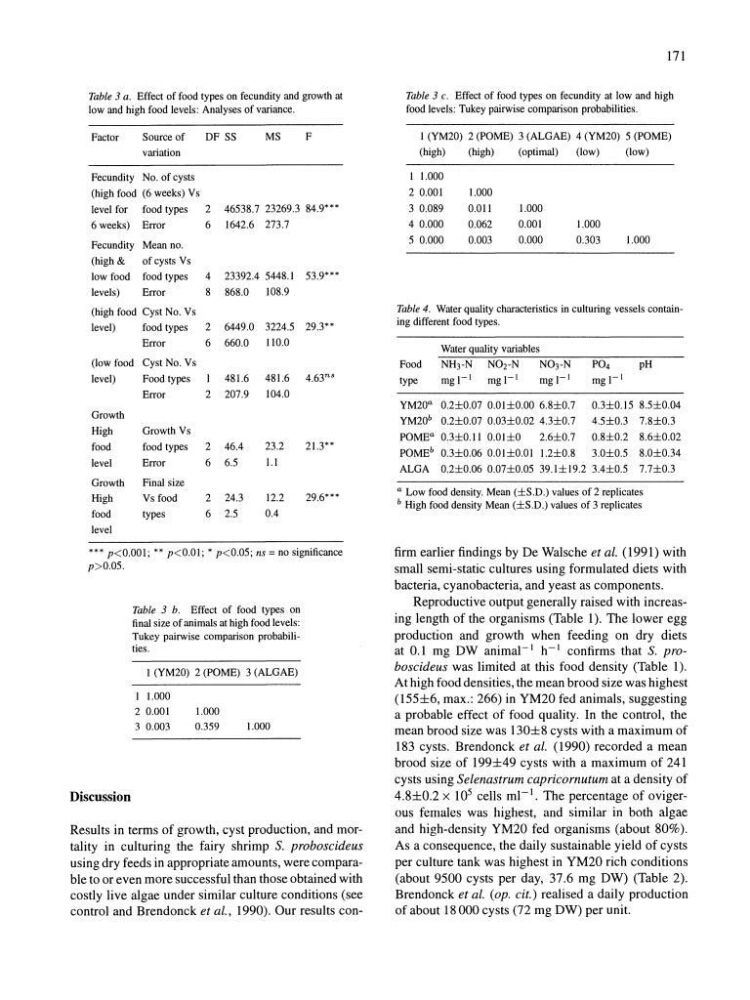
Table 3 a. Effect of food types on fecundity and growth at
low and high food levels: Analyses of variance.
Factor
Source of
OF SS
variation
Fecundity No. of cysts
(high food (6 weeks) Vs
MS
F
level for food types
2 46538.7 23269.3 84.9***
6 weeks) Error
6 1642.6 273.7
Fecundity Mean no.
(high &
of cysts Vs
low food food types
4 23392.4 5448.1 53.9***
levels)
Error
8 868.0
108.9
(high food Cyst No. Vs
level)
food types
2 6449.0 3224.5 29.3**
Error
6 660.0
110.0
(low food Cyst No. Vs
level)
Food types
481.6
481.6
4.63 ns
Error
2 207.9
104.0
Growth
High
Growth Vs
food
food types
2 46.4
23.2
21.3**
level
Error
6 6.5
l.l
Growth
Final size
High
Vs food
2 24.3
12.2
29.6***
food
types
6 2.5
0.4
level
*** p
Discussion
Table 3 b. Effect of food types on
final size of animals at high food levels:
Tukey pairwise comparison probabilities.
I (YM20) 2 (POME) 3 (ALGAE)
1.000
2 0.001
3 0.003
1.000
0.359
1.000
Results in terms of growth, cyst production, and mortality in culturing the fairy shrimp S. proboscideus
using dry feeds in appropriate amounts, were comparable to or even more successful than those obtained with
costly live algae under similar culture conditions (see
control and Brendonck et at., 1990). Our results con171
Table 3 c. Effect of food types on fecundity at low and high
food levels: Tukey pairwise comparison probabilities.
1 (YM20) 2 (POME) 3 (ALGAE) 4 (YM20) 5 (POME)
(high)
(high)
(optimal)
(low)
(low)
I 1.000
2 0.001
1.000
3 0.089
0.011
1.000
4 0.000
0.062
0.001
1.000
5 0.000
0.003
0.000
0.303
1.000
Table 4. Water quality characteristics in culturing vessels containing different food types.
Water quality variables
Food
NH3-N N02-N
N03-N
type
mg I-I
mg I-I
mg I-I
YM20 a 0.2±0.07 0.0l±0.00 6.8±0.7
0.3±0.15 8.5±0.04
YM20 b 0.2±0.07 0.03±0.02 4.3±0.7
4.5±0.3 7.8±0.3
POME a 0.3±0.11 0.01±0
2.6±0.7
0.8±0.2 8.6±0.02
POME b 0.3±0.06 0.01±0.01 1.2±0.8
3.0±0.5 8.0±0.34
ALGA 0.2±0.06 0.07±0.05 39.1±19.2 3.4±0.5 7.7±0.3
a Low food density. Mean (±S.O.) values of 2 replicates
b High food density Mean (±S.O.) values of 3 replicates
firm earlier findings by De Walsche et al. (1991) with
small semi-static cultures using formulated diets with
bacteria, cyanobacteria, and yeast as components.
Reproductive output generally raised with increasing length of the organisms (Table 1). The lower egg
production and growth when feeding on dry diets
at 0.1 mg DW animal-I h- I confirms that S. proboscideus was limited at this food density (Table 1).
At high food densities, the mean brood size was highest
(155±6, max.: 266) in YM20 fed animals, suggesting
a probable effect of food quality. In the control, the
mean brood size was 130±8 cysts with a maximum of
183 cysts. Brendonck et at. (1990) recorded a mean
brood size of 199±49 cysts with a maximum of 241
cysts using Selenastrum capricornutum at a density of
4.8±0.2 x 10 5 cells ml- I • The percentage of ovigerous females was highest, and similar in both algae
and high-density YM20 fed organisms (about 80%).
As a consequence, the daily sustainable yield of cysts
per culture tank was highest in YM20 rich conditions
(about 9500 cysts per day, 37.6 mg DW) (Table 2).
Brendonck et at. (op. cit.) realised a daily production
of about 18000 cysts (72 mg DW) per unit.
low and high food levels: Analyses of variance.
Factor
Source of
OF SS
variation
Fecundity No. of cysts
(high food (6 weeks) Vs
MS
F
level for food types
2 46538.7 23269.3 84.9***
6 weeks) Error
6 1642.6 273.7
Fecundity Mean no.
(high &
of cysts Vs
low food food types
4 23392.4 5448.1 53.9***
levels)
Error
8 868.0
108.9
(high food Cyst No. Vs
level)
food types
2 6449.0 3224.5 29.3**
Error
6 660.0
110.0
(low food Cyst No. Vs
level)
Food types
481.6
481.6
4.63 ns
Error
2 207.9
104.0
Growth
High
Growth Vs
food
food types
2 46.4
23.2
21.3**
level
Error
6 6.5
l.l
Growth
Final size
High
Vs food
2 24.3
12.2
29.6***
food
types
6 2.5
0.4
level
*** p
Discussion
Table 3 b. Effect of food types on
final size of animals at high food levels:
Tukey pairwise comparison probabilities.
I (YM20) 2 (POME) 3 (ALGAE)
1.000
2 0.001
3 0.003
1.000
0.359
1.000
Results in terms of growth, cyst production, and mortality in culturing the fairy shrimp S. proboscideus
using dry feeds in appropriate amounts, were comparable to or even more successful than those obtained with
costly live algae under similar culture conditions (see
control and Brendonck et at., 1990). Our results con171
Table 3 c. Effect of food types on fecundity at low and high
food levels: Tukey pairwise comparison probabilities.
1 (YM20) 2 (POME) 3 (ALGAE) 4 (YM20) 5 (POME)
(high)
(high)
(optimal)
(low)
(low)
I 1.000
2 0.001
1.000
3 0.089
0.011
1.000
4 0.000
0.062
0.001
1.000
5 0.000
0.003
0.000
0.303
1.000
Table 4. Water quality characteristics in culturing vessels containing different food types.
Water quality variables
Food
NH3-N N02-N
N03-N
type
mg I-I
mg I-I
mg I-I
YM20 a 0.2±0.07 0.0l±0.00 6.8±0.7
0.3±0.15 8.5±0.04
YM20 b 0.2±0.07 0.03±0.02 4.3±0.7
4.5±0.3 7.8±0.3
POME a 0.3±0.11 0.01±0
2.6±0.7
0.8±0.2 8.6±0.02
POME b 0.3±0.06 0.01±0.01 1.2±0.8
3.0±0.5 8.0±0.34
ALGA 0.2±0.06 0.07±0.05 39.1±19.2 3.4±0.5 7.7±0.3
a Low food density. Mean (±S.O.) values of 2 replicates
b High food density Mean (±S.O.) values of 3 replicates
firm earlier findings by De Walsche et al. (1991) with
small semi-static cultures using formulated diets with
bacteria, cyanobacteria, and yeast as components.
Reproductive output generally raised with increasing length of the organisms (Table 1). The lower egg
production and growth when feeding on dry diets
at 0.1 mg DW animal-I h- I confirms that S. proboscideus was limited at this food density (Table 1).
At high food densities, the mean brood size was highest
(155±6, max.: 266) in YM20 fed animals, suggesting
a probable effect of food quality. In the control, the
mean brood size was 130±8 cysts with a maximum of
183 cysts. Brendonck et at. (1990) recorded a mean
brood size of 199±49 cysts with a maximum of 241
cysts using Selenastrum capricornutum at a density of
4.8±0.2 x 10 5 cells ml- I • The percentage of ovigerous females was highest, and similar in both algae
and high-density YM20 fed organisms (about 80%).
As a consequence, the daily sustainable yield of cysts
per culture tank was highest in YM20 rich conditions
(about 9500 cysts per day, 37.6 mg DW) (Table 2).
Brendonck et at. (op. cit.) realised a daily production
of about 18000 cysts (72 mg DW) per unit.