

170
15
E
E
..c: .....
Cl
c: 10
Q)
..J
20
~ 15
..c: .....
Cl
c:
Q)
..J
10
,
,
.. ·f
2
3
4
5
6
Time (weeks)
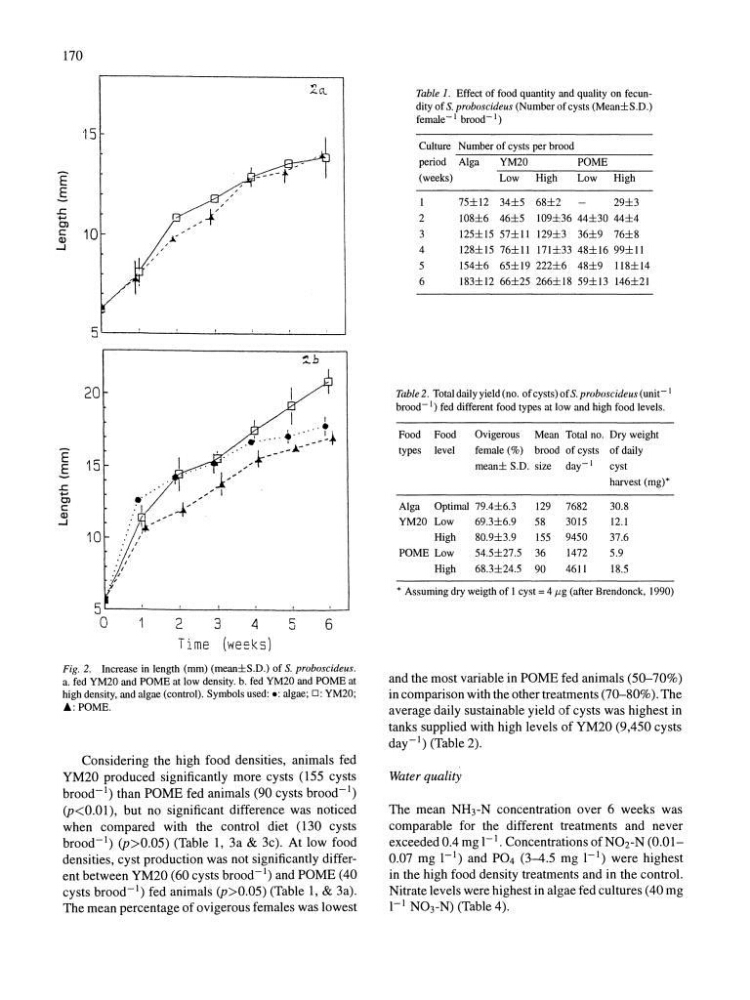
Fig. 2. Increase in length (mm) (mean±S.D.) of S. proboscideus.
a. fed YM20 and POME at low density. b. fed YM20 and POME at
high density, and algae (control). Symbols used: e: algae; 0: YM20;
A:POME.
Considering the high food densities, animals fed
YM20 produced significantly more cysts (155 cysts
brood-I) than POME fed animals (90 cysts brood-I)
(p<0.01), but no significant difference was noticed
when compared with the control diet (130 cysts
brood-I) (p>0.05) (Table 1, 3a & 3c). At low food
densities, cyst production was not significantly different between YM20 (60 cysts brood-I) and POME (40
cysts brood-I) fed animals (p>0.05) (Table 1, & 3a).
The mean percentage of ovigerous females was lowest
Table 1. Effect of food quantity and quality on fecundity of S. proboscideus (Number of cysts (Mean±S.D.)
female-I brood-I)
Culture Number of cysts per brood
period Alga
YM20
POME
(weeks)
Low
High
Low
High
I
2
3
4
5
6
75±12 34±5 68±2
29±3
108±6 46±5 109:±:36 44±30 44±4
125±15 57±1l 129±3 36±9 76±8
128±15 76±1l 171±33 48±16 99±1l
154±6 65±19 222±6 48±9 118±14
183±12 66±25 266±18 59±13 146±21
Table 2. Total daily yield (no. of cysts) of S. proboscideus (uniC 1
brood-I) fed different food types at low and high food levels.
Food Food
Ovigerous Mean Total no. Dry weight
types level
female (%) brood of cysts of daily
mean± S.D. size day-I
cyst
harvest (mg)*
Alga Optimal 79.4±6.3
129 7682
30.8
YM20 Low
69.3±6.9
58
3015
12.1
High
80.9±3.9
155 9450
37.6
POME Low
54.5±27.5 36
1472
5.9
High
68.3±24.5 90
4611
18.5
* Assuming dry weigth of 1 cyst = 41lg (after Brendonck, 1990)
and the most variable in POME fed animals (50-70%)
in comparison with the other treatments (70-80%). The
average daily sustainable yield of cysts was highest in
tanks supplied with high levels of YM20 (9,450 cysts
day-I) (Table 2).
Water quality
The mean NH3-N concentration over 6 weeks was
comparable for the different treatments and never
exceeded 0.4 mg I-I. Concentrations of N02-N (0.010.07 mg I-I) and P04 (3-4.5 mg I-I) were highest
in the high food density treatments and in the control.
Nitrate levels were highest in algae fed cultures (40 mg
I-I N03-N) (Table 4).
15
E
E
..c: .....
Cl
c: 10
Q)
..J
20
~ 15
..c: .....
Cl
c:
Q)
..J
10
,
,
.. ·f
2
3
4
5
6
Time (weeks)
Fig. 2. Increase in length (mm) (mean±S.D.) of S. proboscideus.
a. fed YM20 and POME at low density. b. fed YM20 and POME at
high density, and algae (control). Symbols used: e: algae; 0: YM20;
A:POME.
Considering the high food densities, animals fed
YM20 produced significantly more cysts (155 cysts
brood-I) than POME fed animals (90 cysts brood-I)
(p<0.01), but no significant difference was noticed
when compared with the control diet (130 cysts
brood-I) (p>0.05) (Table 1, 3a & 3c). At low food
densities, cyst production was not significantly different between YM20 (60 cysts brood-I) and POME (40
cysts brood-I) fed animals (p>0.05) (Table 1, & 3a).
The mean percentage of ovigerous females was lowest
Table 1. Effect of food quantity and quality on fecundity of S. proboscideus (Number of cysts (Mean±S.D.)
female-I brood-I)
Culture Number of cysts per brood
period Alga
YM20
POME
(weeks)
Low
High
Low
High
I
2
3
4
5
6
75±12 34±5 68±2
29±3
108±6 46±5 109:±:36 44±30 44±4
125±15 57±1l 129±3 36±9 76±8
128±15 76±1l 171±33 48±16 99±1l
154±6 65±19 222±6 48±9 118±14
183±12 66±25 266±18 59±13 146±21
Table 2. Total daily yield (no. of cysts) of S. proboscideus (uniC 1
brood-I) fed different food types at low and high food levels.
Food Food
Ovigerous Mean Total no. Dry weight
types level
female (%) brood of cysts of daily
mean± S.D. size day-I
cyst
harvest (mg)*
Alga Optimal 79.4±6.3
129 7682
30.8
YM20 Low
69.3±6.9
58
3015
12.1
High
80.9±3.9
155 9450
37.6
POME Low
54.5±27.5 36
1472
5.9
High
68.3±24.5 90
4611
18.5
* Assuming dry weigth of 1 cyst = 41lg (after Brendonck, 1990)
and the most variable in POME fed animals (50-70%)
in comparison with the other treatments (70-80%). The
average daily sustainable yield of cysts was highest in
tanks supplied with high levels of YM20 (9,450 cysts
day-I) (Table 2).
Water quality
The mean NH3-N concentration over 6 weeks was
comparable for the different treatments and never
exceeded 0.4 mg I-I. Concentrations of N02-N (0.010.07 mg I-I) and P04 (3-4.5 mg I-I) were highest
in the high food density treatments and in the control.
Nitrate levels were highest in algae fed cultures (40 mg
I-I N03-N) (Table 4).