

102
N
'"
' ;:;:
«
BumedW""".i. et.S.1
Bu.med. ~~~ .• ~.2
Unburned.Dry.L
Burned Wet. L.1
Unburned.Dry.S
Burned. Dry. L
Burned.Dry.S
Community Structure
UnbumedWet.L.1
UnburnedWet.L.2
Axis 1
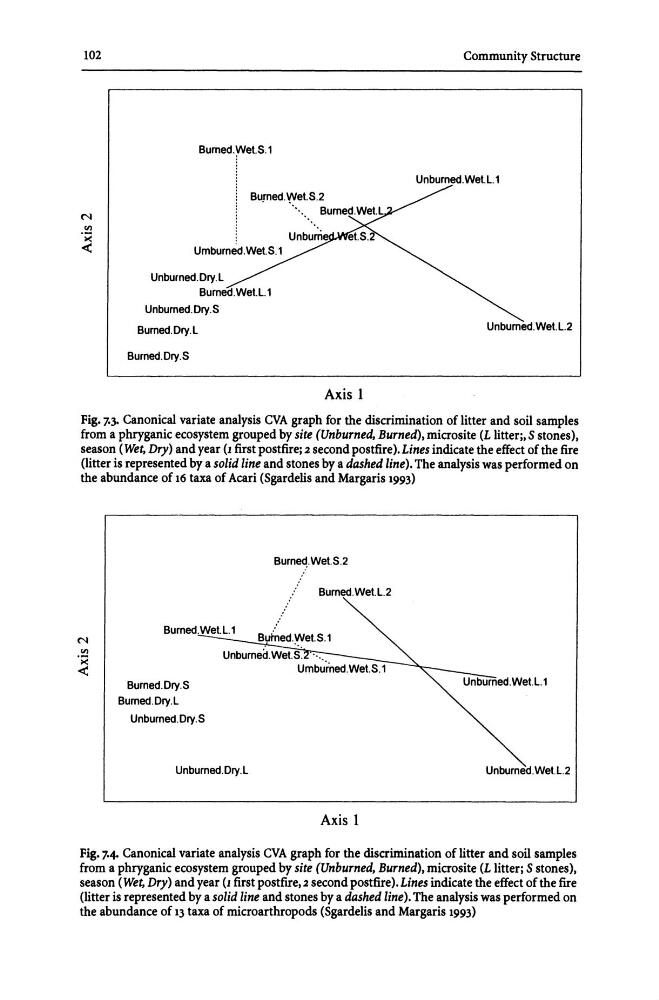
Fig. 7.3. Canonical variate analysis CVA graph for the discrimination of litter and soil samples
from a phryganic ecosystem grouped by site (Unburned, Burned), microsite (L litter;, S stones),
season (Wet, Dry) and year (J first postfire; 2 second postfire), Lines indicate the effect of the fire
(litter is represented by a solid line and stones by a dashed line). The analysis was performed on
the abundance of 16 taxa of Acari (Sgardelis and Margaris 1993)
N
'"
' ;:;:
«
Burned.Dry.S
Burned.Dry.L
Unburned.Dry.S
Unburned.Dry.L
Burne~Wet.S.2
Burned. Wet. L.2
Butned.'!Vet.S.1
Axis 1
UnburnedWet.L.2
Fig. 7.4. Canonical variate analysis CVA graph for the discrimination of litter and soil samples
from a phryganic ecosystem grouped by site (Unburned, Burned), microsite (L litter; S stones),
season (Wet, Dry) and year (1 first postfire, 2 second postfire). Lines indicate the effect of the fire
(litter is represented by a solid line and stones by a dashed line). The analysis was performed on
the abundance of 13 taxa of microarthropods (Sgardelis and Margaris 1993)
N
'"
' ;:;:
«
BumedW""".i. et.S.1
Bu.med. ~~~ .• ~.2
Unburned.Dry.L
Burned Wet. L.1
Unburned.Dry.S
Burned. Dry. L
Burned.Dry.S
Community Structure
UnbumedWet.L.1
UnburnedWet.L.2
Axis 1
Fig. 7.3. Canonical variate analysis CVA graph for the discrimination of litter and soil samples
from a phryganic ecosystem grouped by site (Unburned, Burned), microsite (L litter;, S stones),
season (Wet, Dry) and year (J first postfire; 2 second postfire), Lines indicate the effect of the fire
(litter is represented by a solid line and stones by a dashed line). The analysis was performed on
the abundance of 16 taxa of Acari (Sgardelis and Margaris 1993)
N
'"
' ;:;:
«
Burned.Dry.S
Burned.Dry.L
Unburned.Dry.S
Unburned.Dry.L
Burne~Wet.S.2
Burned. Wet. L.2
Butned.'!Vet.S.1
Axis 1
UnburnedWet.L.2
Fig. 7.4. Canonical variate analysis CVA graph for the discrimination of litter and soil samples
from a phryganic ecosystem grouped by site (Unburned, Burned), microsite (L litter; S stones),
season (Wet, Dry) and year (1 first postfire, 2 second postfire). Lines indicate the effect of the fire
(litter is represented by a solid line and stones by a dashed line). The analysis was performed on
the abundance of 13 taxa of microarthropods (Sgardelis and Margaris 1993)