

20
A.B. Goya and S. Maldonado
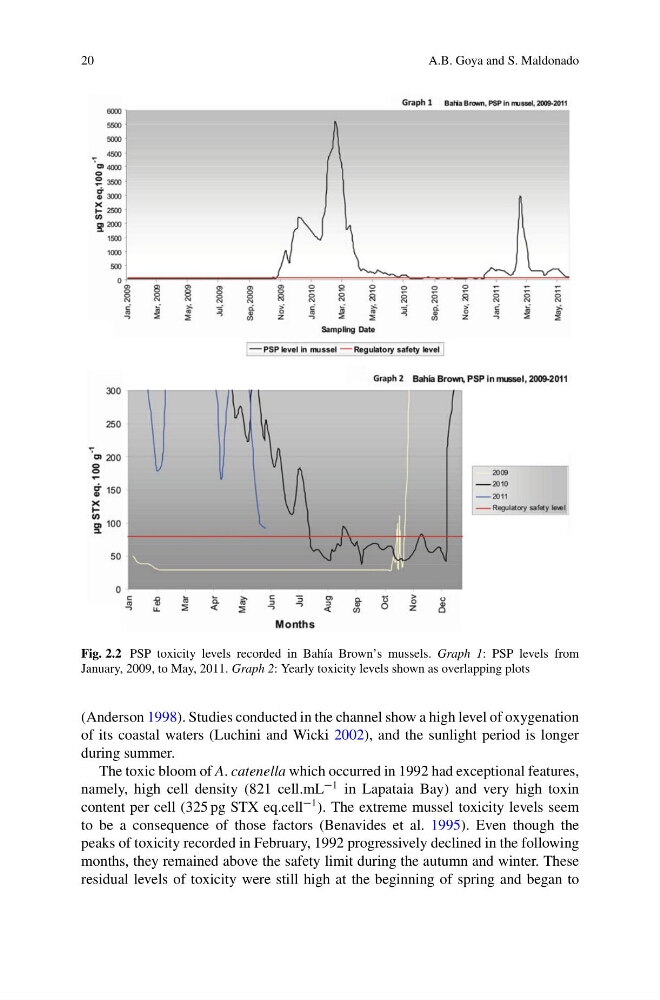
Fig. 2.2 PSP toxicity levels recorded in Bah´ ıa Brown’s mussels. Graph 1: PSP levels from
January, 2009, to May, 2011. Graph 2: Yearly toxicity levels shown as overlapping plots
(Anderson 1998). Studies conducted in the channel show a high level of oxygenation
of its coastal waters (Luchini and Wicki 2002), and the sunlight period is longer
during summer.
The toxic bloom of A. catenella which occurred in 1992 had exceptional features,
namely, high cell density (821 cell.mL
1 in Lapataia Bay) and very high toxin
content per cell (325 pg STX eq.cell
1 ). The extreme mussel toxicity levels seem
to be a consequence of those factors (Benavides et al. 1995). Even though the
peaks of toxicity recorded in February, 1992 progressively declined in the following
months, they remained above the safety limit during the autumn and winter. These
residual levels of toxicity were still high at the beginning of spring and began to
A.B. Goya and S. Maldonado
Fig. 2.2 PSP toxicity levels recorded in Bah´ ıa Brown’s mussels. Graph 1: PSP levels from
January, 2009, to May, 2011. Graph 2: Yearly toxicity levels shown as overlapping plots
(Anderson 1998). Studies conducted in the channel show a high level of oxygenation
of its coastal waters (Luchini and Wicki 2002), and the sunlight period is longer
during summer.
The toxic bloom of A. catenella which occurred in 1992 had exceptional features,
namely, high cell density (821 cell.mL
1 in Lapataia Bay) and very high toxin
content per cell (325 pg STX eq.cell
1 ). The extreme mussel toxicity levels seem
to be a consequence of those factors (Benavides et al. 1995). Even though the
peaks of toxicity recorded in February, 1992 progressively declined in the following
months, they remained above the safety limit during the autumn and winter. These
residual levels of toxicity were still high at the beginning of spring and began to