

18 A Comparison of Assay Techniques for the Analysis of Diarrhetic Shellfish. . .
209
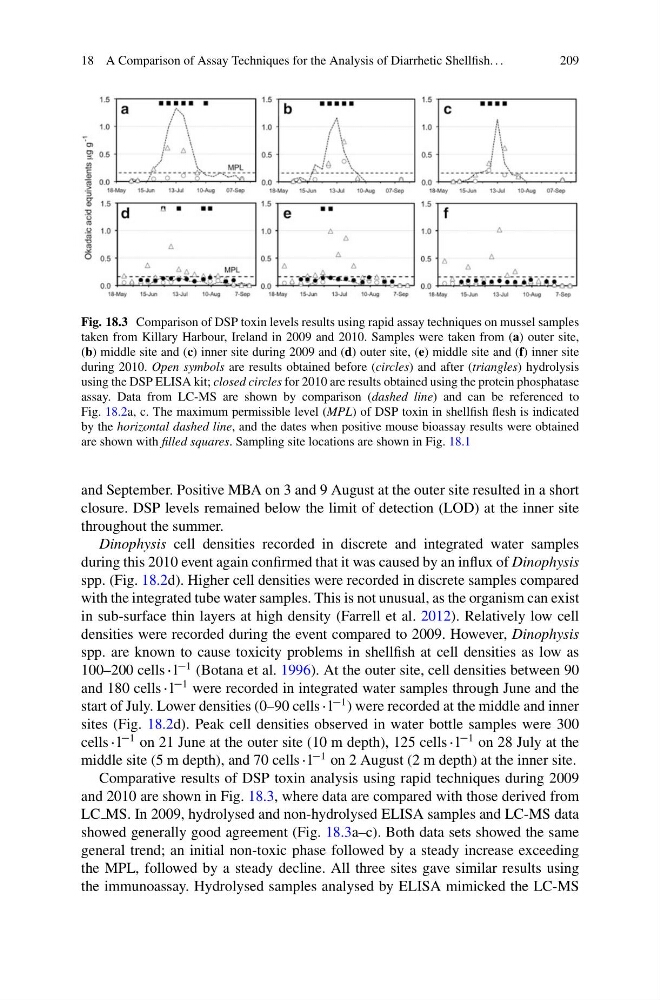
Fig. 18.3 Comparison of DSP toxin levels results using rapid assay techniques on mussel samples
taken from Killary Harbour, Ireland in 2009 and 2010. Samples were taken from (a) outer site,
(b) middle site and (c) inner site during 2009 and (d) outer site, (e) middle site and (f) inner site
during 2010. Open symbols are results obtained before (circles) and after (triangles) hydrolysis
using the DSP ELISA kit; closed circles for 2010 are results obtained using the protein phosphatase
assay. Data from LC-MS are shown by comparison (dashed line) and can be referenced to
Fig. 18.2a, c. The maximum permissible level (MPL) of DSP toxin in shellfish flesh is indicated
by the horizontal dashed line, and the dates when positive mouse bioassay results were obtained
are shown with filled squares. Sampling site locations are shown in Fig. 18.1
and September. Positive MBA on 3 and 9 August at the outer site resulted in a short
closure. DSP levels remained below the limit of detection (LOD) at the inner site
throughout the summer.
Dinophysis cell densities recorded in discrete and integrated water samples
during this 2010 event again confirmed that it was caused by an influx of Dinophysis
spp. (Fig. 18.2d). Higher cell densities were recorded in discrete samples compared
with the integrated tube water samples. This is not unusual, as the organism can exist
in sub-surface thin layers at high density (Farrell et al. 2012). Relatively low cell
densities were recorded during the event compared to 2009. However, Dinophysis
spp. are known to cause toxicity problems in shellfish at cell densities as low as
100–200 cells l
1 (Botana et al. 1996). At the outer site, cell densities between 90
and 180 cells l
1 were recorded in integrated water samples through June and the
start of July. Lower densities (0–90 cells l
1 ) were recorded at the middle and inner
sites (Fig. 18.2d). Peak cell densities observed in water bottle samples were 300
cells l
1 on 21 June at the outer site (10 m depth), 125 cells l
1 on 28 July at the
middle site (5 m depth), and 70 cells l
1 on 2 August (2 m depth) at the inner site.
Comparative results of DSP toxin analysis using rapid techniques during 2009
and 2010 are shown in Fig. 18.3, where data are compared with those derived from
LC MS. In 2009, hydrolysed and non-hydrolysed ELISA samples and LC-MS data
showed generally good agreement (Fig. 18.3a–c). Both data sets showed the same
general trend; an initial non-toxic phase followed by a steady increase exceeding
the MPL, followed by a steady decline. All three sites gave similar results using
the immunoassay. Hydrolysed samples analysed by ELISA mimicked the LC-MS
209
Fig. 18.3 Comparison of DSP toxin levels results using rapid assay techniques on mussel samples
taken from Killary Harbour, Ireland in 2009 and 2010. Samples were taken from (a) outer site,
(b) middle site and (c) inner site during 2009 and (d) outer site, (e) middle site and (f) inner site
during 2010. Open symbols are results obtained before (circles) and after (triangles) hydrolysis
using the DSP ELISA kit; closed circles for 2010 are results obtained using the protein phosphatase
assay. Data from LC-MS are shown by comparison (dashed line) and can be referenced to
Fig. 18.2a, c. The maximum permissible level (MPL) of DSP toxin in shellfish flesh is indicated
by the horizontal dashed line, and the dates when positive mouse bioassay results were obtained
are shown with filled squares. Sampling site locations are shown in Fig. 18.1
and September. Positive MBA on 3 and 9 August at the outer site resulted in a short
closure. DSP levels remained below the limit of detection (LOD) at the inner site
throughout the summer.
Dinophysis cell densities recorded in discrete and integrated water samples
during this 2010 event again confirmed that it was caused by an influx of Dinophysis
spp. (Fig. 18.2d). Higher cell densities were recorded in discrete samples compared
with the integrated tube water samples. This is not unusual, as the organism can exist
in sub-surface thin layers at high density (Farrell et al. 2012). Relatively low cell
densities were recorded during the event compared to 2009. However, Dinophysis
spp. are known to cause toxicity problems in shellfish at cell densities as low as
100–200 cells l
1 (Botana et al. 1996). At the outer site, cell densities between 90
and 180 cells l
1 were recorded in integrated water samples through June and the
start of July. Lower densities (0–90 cells l
1 ) were recorded at the middle and inner
sites (Fig. 18.2d). Peak cell densities observed in water bottle samples were 300
cells l
1 on 21 June at the outer site (10 m depth), 125 cells l
1 on 28 July at the
middle site (5 m depth), and 70 cells l
1 on 2 August (2 m depth) at the inner site.
Comparative results of DSP toxin analysis using rapid techniques during 2009
and 2010 are shown in Fig. 18.3, where data are compared with those derived from
LC MS. In 2009, hydrolysed and non-hydrolysed ELISA samples and LC-MS data
showed generally good agreement (Fig. 18.3a–c). Both data sets showed the same
general trend; an initial non-toxic phase followed by a steady increase exceeding
the MPL, followed by a steady decline. All three sites gave similar results using
the immunoassay. Hydrolysed samples analysed by ELISA mimicked the LC-MS