

194
T.S. Guldberg et al.
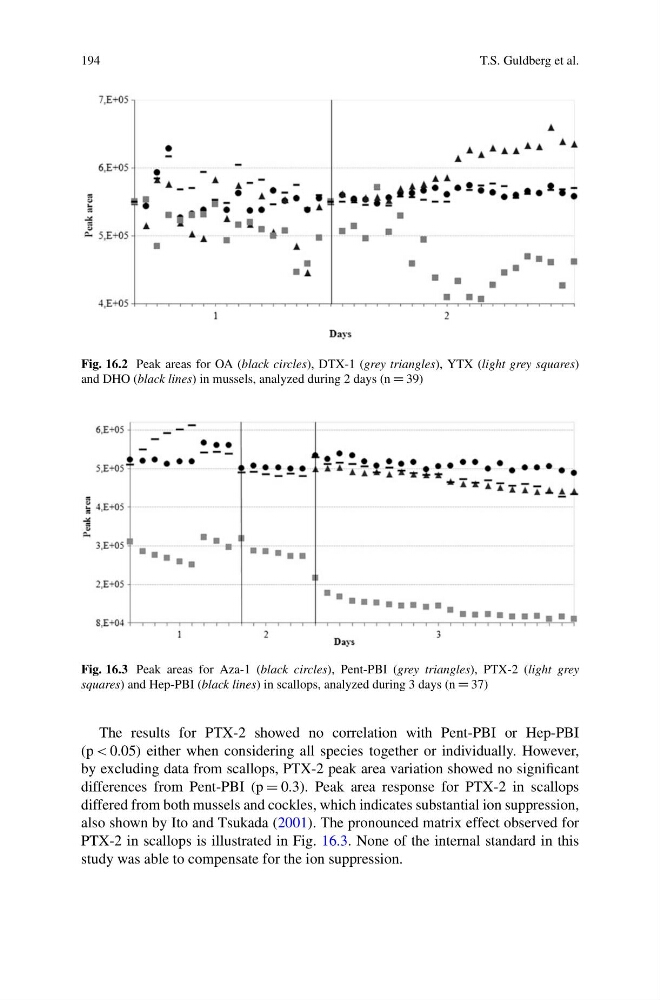
Fig. 16.2 Peak areas for OA (black circles), DTX-1 (grey triangles), YTX (light grey squares)
and DHO (black lines) in mussels, analyzed during 2 days (n D 39)
Fig. 16.3 Peak areas for Aza-1 (black circles), Pent-PBI (grey triangles), PTX-2 (light grey
squares) and Hep-PBI (black lines) in scallops, analyzed during 3 days (n D 37)
The results for PTX-2 showed no correlation with Pent-PBI or Hep-PBI
(p < 0.05) either when considering all species together or individually. However,
by excluding data from scallops, PTX-2 peak area variation showed no significant
differences from Pent-PBI (p D 0.3). Peak area response for PTX-2 in scallops
differed from both mussels and cockles, which indicates substantial ion suppression,
also shown by Ito and Tsukada (2001). The pronounced matrix effect observed for
PTX-2 in scallops is illustrated in Fig. 16.3. None of the internal standard in this
study was able to compensate for the ion suppression.
T.S. Guldberg et al.
Fig. 16.2 Peak areas for OA (black circles), DTX-1 (grey triangles), YTX (light grey squares)
and DHO (black lines) in mussels, analyzed during 2 days (n D 39)
Fig. 16.3 Peak areas for Aza-1 (black circles), Pent-PBI (grey triangles), PTX-2 (light grey
squares) and Hep-PBI (black lines) in scallops, analyzed during 3 days (n D 37)
The results for PTX-2 showed no correlation with Pent-PBI or Hep-PBI
(p < 0.05) either when considering all species together or individually. However,
by excluding data from scallops, PTX-2 peak area variation showed no significant
differences from Pent-PBI (p D 0.3). Peak area response for PTX-2 in scallops
differed from both mussels and cockles, which indicates substantial ion suppression,
also shown by Ito and Tsukada (2001). The pronounced matrix effect observed for
PTX-2 in scallops is illustrated in Fig. 16.3. None of the internal standard in this
study was able to compensate for the ion suppression.