

170
D. Polo et al.
Table 14.1 Depuration trials
(designated as 1–5) on
mussels contaminated with
MNV-1
T r i a l 1
2
3
4
5
A v
a
T P
0
0
0
0
0
0( ˙0.0)
T 0
5.44 5.88 4.66 5.72 5.11 5.36 (˙0.5)
T 1
5.41 5.82 5.56 4.86 4.69 5.27 (˙0.5)
T 2
4.85 5.22 5.01 5.94 4.57 5.12 (˙0.5)
T 3
4.98 5.27 5.03 5.13 4.63 5.01 (˙0.2)
T 4
4.54 5.15 4.93 4.20 4.32 4.63 (˙0.4)
T 5
4.90 5.04 4.81 4.53 4.43 4.74 (˙0.3)
T 6
5.02 4.83 4.59 4.86 3.86 4.63 (˙0.5)
T 7
4.68 4.89 4.56 4.14 4.44 4.54 (˙0.3)
vr
b
0.76 0.99 0.10 1.59 0.67 0.82 (˙0.54)
Results are as expressed as logRNA copies/g digestive tissues.
T P sampling at shellfish arrival, T 0 sampling at transfer of
shellfish from bioaccumulation tanks to depuration system,
T 1 –T 7 day 1–7 samplings during purification process
a Average of the five-depuration trials and standard deviation
b Log virus reduction at the end of depuration
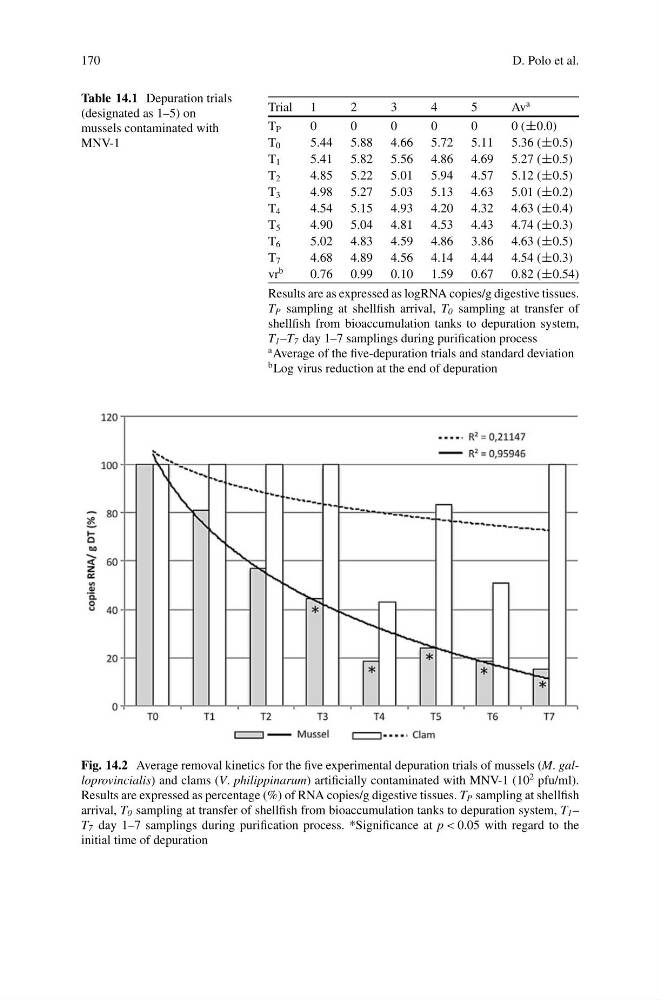
Fig. 14.2 Average removal kinetics for the five experimental depuration trials of mussels (M. galloprovincialis) and clams (V. philippinarum) artificially contaminated with MNV-1 (10
2 pfu/ml).
Results are expressed as percentage (%) of RNA copies/g digestive tissues. T P sampling at shellfish
arrival, T 0 sampling at transfer of shellfish from bioaccumulation tanks to depuration system, T 1 –
T 7 day 1–7 samplings during purification process. *Significance at p < 0.05 with regard to the
initial time of depuration
D. Polo et al.
Table 14.1 Depuration trials
(designated as 1–5) on
mussels contaminated with
MNV-1
T r i a l 1
2
3
4
5
A v
a
T P
0
0
0
0
0
0( ˙0.0)
T 0
5.44 5.88 4.66 5.72 5.11 5.36 (˙0.5)
T 1
5.41 5.82 5.56 4.86 4.69 5.27 (˙0.5)
T 2
4.85 5.22 5.01 5.94 4.57 5.12 (˙0.5)
T 3
4.98 5.27 5.03 5.13 4.63 5.01 (˙0.2)
T 4
4.54 5.15 4.93 4.20 4.32 4.63 (˙0.4)
T 5
4.90 5.04 4.81 4.53 4.43 4.74 (˙0.3)
T 6
5.02 4.83 4.59 4.86 3.86 4.63 (˙0.5)
T 7
4.68 4.89 4.56 4.14 4.44 4.54 (˙0.3)
vr
b
0.76 0.99 0.10 1.59 0.67 0.82 (˙0.54)
Results are as expressed as logRNA copies/g digestive tissues.
T P sampling at shellfish arrival, T 0 sampling at transfer of
shellfish from bioaccumulation tanks to depuration system,
T 1 –T 7 day 1–7 samplings during purification process
a Average of the five-depuration trials and standard deviation
b Log virus reduction at the end of depuration
Fig. 14.2 Average removal kinetics for the five experimental depuration trials of mussels (M. galloprovincialis) and clams (V. philippinarum) artificially contaminated with MNV-1 (10
2 pfu/ml).
Results are expressed as percentage (%) of RNA copies/g digestive tissues. T P sampling at shellfish
arrival, T 0 sampling at transfer of shellfish from bioaccumulation tanks to depuration system, T 1 –
T 7 day 1–7 samplings during purification process. *Significance at p < 0.05 with regard to the
initial time of depuration