

130
H. Toyofuku
Methods
The number of cases and outbreaks of Vp infection were obtained from the Food
Poisoning Investigation Report published by the MHLW, Japan (2000, 2001, 2002,
2003, 2005, 2006, 2007, 2008, 2009, 2010, 2011a, b).
Data on the number of outbreaks caused by different serotypes were obtained
from the risk profile prepared by the Food Safety Commission (2012).
Food source attribution obtained through Vp outbreak investigations in 2000–
2009 was reviewed based on the summary of food poisoning reports published by
the MHLW.
The implemented risk management strategies were identified based on the
regulations and directives published by the MHLW.
Results
Since Japanese people eat raw seafood, they are often exposed and are frequently
infected by Vp. Therefore, Vp-related food poisoning has been the most frequently
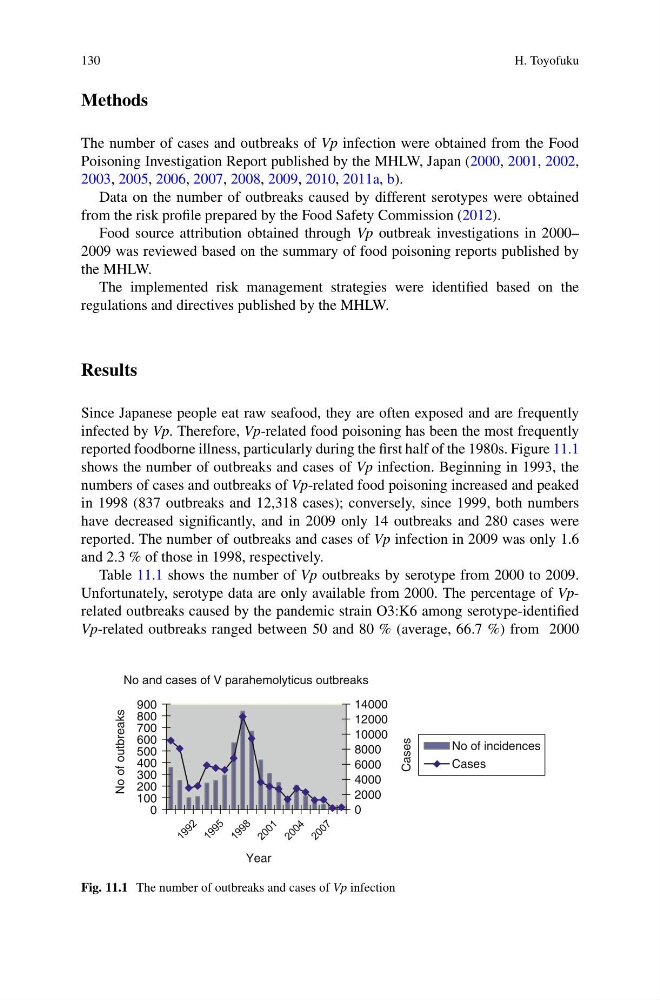
reported foodborne illness, particularly during the first half of the 1980s. Figure 11.1
shows the number of outbreaks and cases of Vp infection. Beginning in 1993, the
numbers of cases and outbreaks of Vp-related food poisoning increased and peaked
in 1998 (837 outbreaks and 12,318 cases); conversely, since 1999, both numbers
have decreased significantly, and in 2009 only 14 outbreaks and 280 cases were
reported. The number of outbreaks and cases of Vp infection in 2009 was only 1.6
and 2.3 % of those in 1998, respectively.
Table 11.1 shows the number of Vp outbreaks by serotype from 2000 to 2009.
Unfortunately, serotype data are only available from 2000. The percentage of Vprelated outbreaks caused by the pandemic strain O3:K6 among serotype-identified
Vp-related outbreaks ranged between 50 and 80 % (average, 66.7 %) from 2000
0
2000
4000
6000
8000
10000
12000
14000
0
100
200
300
400
500
600
700
800
900
Cases
No of outbreaks
Year
No and cases of V parahemolyticus outbreaks
No of incidences
Cases
Fig. 11.1 The number of outbreaks and cases of Vp infection
H. Toyofuku
Methods
The number of cases and outbreaks of Vp infection were obtained from the Food
Poisoning Investigation Report published by the MHLW, Japan (2000, 2001, 2002,
2003, 2005, 2006, 2007, 2008, 2009, 2010, 2011a, b).
Data on the number of outbreaks caused by different serotypes were obtained
from the risk profile prepared by the Food Safety Commission (2012).
Food source attribution obtained through Vp outbreak investigations in 2000–
2009 was reviewed based on the summary of food poisoning reports published by
the MHLW.
The implemented risk management strategies were identified based on the
regulations and directives published by the MHLW.
Results
Since Japanese people eat raw seafood, they are often exposed and are frequently
infected by Vp. Therefore, Vp-related food poisoning has been the most frequently
reported foodborne illness, particularly during the first half of the 1980s. Figure 11.1
shows the number of outbreaks and cases of Vp infection. Beginning in 1993, the
numbers of cases and outbreaks of Vp-related food poisoning increased and peaked
in 1998 (837 outbreaks and 12,318 cases); conversely, since 1999, both numbers
have decreased significantly, and in 2009 only 14 outbreaks and 280 cases were
reported. The number of outbreaks and cases of Vp infection in 2009 was only 1.6
and 2.3 % of those in 1998, respectively.
Table 11.1 shows the number of Vp outbreaks by serotype from 2000 to 2009.
Unfortunately, serotype data are only available from 2000. The percentage of Vprelated outbreaks caused by the pandemic strain O3:K6 among serotype-identified
Vp-related outbreaks ranged between 50 and 80 % (average, 66.7 %) from 2000
0
2000
4000
6000
8000
10000
12000
14000
0
100
200
300
400
500
600
700
800
900
Cases
No of outbreaks
Year
No and cases of V parahemolyticus outbreaks
No of incidences
Cases
Fig. 11.1 The number of outbreaks and cases of Vp infection